2001 Team Defense
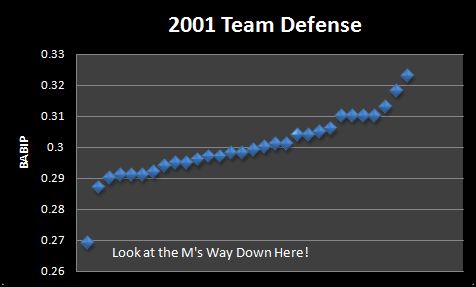
David Appelman revamped the team pages over at FanGraphs, so I’ve been playing around with all kinds of fun new data over the last couple of days. Because we can now sort through all kinds of team totals, by year (or by month, or week, or whatever) going way back, and we can look at the comparisons between teams easily, I can produce a graph like this:
That’s the opponents batting average on balls in play, for each team, in 2001. This is a rough measure of defense – it’s not perfect, but in general, a low BABIP for your opponents means you’re playing some good defense.
Look at the Mariners in relation to the rest of baseball in 2001. The team had a 4.11 FIP, good for 10th in baseball, but still managed to allow the fewest runs in the league because of the remarkably outstanding defense.
As always, the moral of the story – defense matters. A lot.


So, defense wins 116 games but not championships…just kidding
Dave, Is there anyway to measure how much more important defense is in an enviroment that is hard to score runs? Such as Safeco?
I guess I’m just assuming that it is more important to have good defense in a low run scoring enviroment— Is there some good reading you could direct me to on this?
Holy Crap! The Rays were the worst team in 2007 at .338 and the best team in 2008 at .285
I’m a big proponent of Defense in sports. It’s a cliche to say that it wins championships; because it takes a bit of everything to win championships (including luck); but it is extremely important. It always seems that unlike football, baseball seems to barely value defense these days. And that shows with the M’s the past few years particularly.
Dave,
I couldn’t find a “buy the author a beer” quick button so I bought myself one and drank it in your honor….
one of the nice things about defense in the current baseball market is how comparatively cheap it is relative to comparatively valuable offense.
Is there any chance Yuni becomes the defender we once thought he would be?
Dave –
I couldn’t figure out how to reproduce that attractive graph, but I went to Fangraphs to look up 2008 data. If I follow your data correctly, the M’s ’08 BABIP was .313 (6th worst). The Rays (as previously mentioned) were best at .285.
It might be useful to fine tune the posted graph a bit and color the dots of the playoff teams red or something. Then run the graph for ’08 to compare to ’01. Would make for an interesting comparison where a picture becomes worth 1,000 words.
What’s the horizontal axis?
I don’t think there is a horizontal axis. If I’m reading it right, I think it’s just a sampling of the 30 Major League Teams, with each one represented by a point on the graph.
(long, wistful sigh) Those were the days….