
Comparing Mariner Fastball Speeds: April 2012 versus (mostly) April 2011
The loss of a few ticks on Felix Hernandez’s fastball’s the talk of the town these days, and a similar drop landed George Sherrill on the disabled list. What about the rest of the staff – is everyone similarly affected? Who’s thrown harder?
I’ll be honest: I don’t have much of a point here; I don’t know what question I want to attempt to answer with the following data. In part, I wanted to get this out there to refer to later; Felix may decide to throw 94 again in May, and we’ll all look back at this in laugh. Maybe Hector Noesi will throw as hard as he was reported to have thrown in the Dominican (or in his very first Cactus League start). Maybe Kevin Millwood’s velocity will fade back to 2010 levels. This is a starting point. (To be fair, I was also inspired by a post by the great Jeff Zimmerman at Royals Review).
| Pitcher | Velo 2011 | Velo 2012 | Delta |
|---|---|---|---|
| George Sherrill | 89.7 | 86.6 | -3.1 |
| Felix Hernandez | 94.1 | 91.2 | -2.9 |
| Brandon League | 96.6 | 95.6 | -1 |
| Charlie Furbush | 91.6 | 91 | -0.6 |
| Hector Noesi | 93.5 | 93 | -0.5 |
| Blake Beavan | 91.5 | 91.2 | -0.3 |
| Jason Vargas | 88.1 | 88.1 | 0 |
| Steve Delabar | 94.8 | 94.8 | 0 |
| Tom Wilhelmsen | 95.6 | 95.7 | 0.1 |
| Kevin Millwood | 89.8 | 90.5 | 0.7 |
This table includes each pitcher’s average fastball velocity thus far in April compared to their fastball velocity in April of 2011. Now, many of these guys didn’t pitch in April of ’11, so I just took the first month they appeared. That’s not a great comparison, as it means Steve Delabar’s April of ’12 is being compared to his September of ’11. Charlie Furbush and Hector Noesi didn’t appear until May of 2011, Blake Beavan until July, and Kevin Millwood didn’t make the Rockies until August last year. Like I said – not ideal, but it’s what we’ve got and we’ll console ourselves with the fact that velocity stabilizes fairly quickly.
The other issue which I’ll get to below is pitch mix. I’ve used each pitcher’s most common fastball for the table; if someone throws a four-seamer but occasionally mixes in a cutter, I’ve reported the four-seamer. If they mix a four- and two-seamer, I’ve used whichever they throw most. But the FB a pitcher uses most isn’t necessarily the same across seasons. The data all come from Brooksbaseball, so the pitch IDs are done manually, not by the pitch fx algorithm. This is important in the case of Felix or even Furbush where the algorithm has had some difficulty distinguishing fastballs from change-ups.
George Sherrill tops the list as the guy with the biggest velocity drop, and it appears that the cause is a physical one. This isn’t something that came on this spring, however. In fact, it appears that Sherrill’s big velocity drop occurred mid way through 2011; his FB velocity in April of 2011 was fine (about 90), but dropped below 88MPH by June and never recovered. It dropped again at some point, as his average FB from his single April appearance was under 87, but the larger change occurred some time last May. It’ll be interesting to see if rest/physical therapy’s able to get him back to 90, or if he’s going to have to learn to live in the 87.5-88.5 range.
Thus far, Felix hasn’t suffered too much from his lack of velocity – his K rate’s not terribly different from last year’s rate, and the slight drop’s been accompanied by fewer walks, too. Obviously, it’s much too early to say a whole lot – he’s only faced one (awful) team, but he’s faced them three times. I’d rather face the A’s three times than just about anyone else in baseball, but three games against the same team – even the A’s – in a couple of weeks is difficult for a pitcher. If you’re wondering if it takes Felix a few months to hit his top velocity, well, no, it hasn’t in previous years. April was his best month of 2011 for FB velocity, and was one of his best months in 2009 and 2010. As many have pointed out, however, he may struggle in hitters counts in crucial situations if he’s not able to hit 95 on occasion. Justin Verlander’s velocity’s been fairly modest thus far compared to previous years, but he’s been able to add a few MPH in big at-bats. If Felix is able to do that, he should be fine.
Brandon League appears to be someone who needs time to reach his peak velocity. As such, I’m not too worried about his apparent velocity drop thus far. It’s exactly where he was in April of 2010, and he was hitting 97+ later in the summer. He started a bit higher last year, but got to the same peak around the same time. Hopefully, this year’s no different. It’s not like he’s struggled thus far anyway.
I was initially somewhat concerned about Furbush’s velocity in his first appearance since being called up, but the major difference between now and last May is pitch mix. He came up with Detroit throwing a hard four-seamer that got to 92-93 later in the summer, and a rarely-used two-seamer that sat at 91. In his first game this year, he threw *exclusively* two-seamers at the same 91 velocity. The M’s obviously want him to get more grounders, so they’ve changed his release and essentially shelved the four-seamer. I’m of two minds here – on one hand, a ground-ball lefty reliever who can go a few innings is a decent thing to have, and he’s able to contribute now. On the other, this is a starter with a proven ability to miss bats, and the M’s may be harming his ability to get whiffs while also utilizing him in low-leverage middle relief. None of these changes is permanent, of course, but I’m still curious to know what the M’s envision his role is long-term.
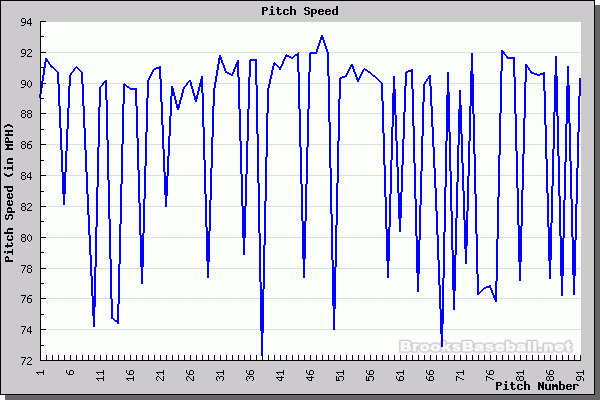
Noesi’s essentially right where he was last May, which is encouraging in itself, as he came up with the Yankees in 2011 as a reliever. If he’s able to maintain his velocity for 7 innings, that’s big news. In his solid start the other day, he started out touching 94 and then slumped a bit to 92 in the later innings, so some improvement in his stamina will increase his average velocity to 93.5-94, which isn’t bad for a #3 starter. 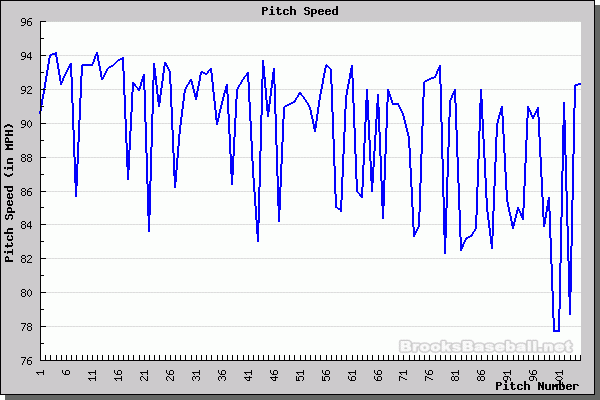
I’m still stunned by just how successful Beavan can be when he’s spotting his 91mph fastball. I’ll always be a touch suspicious after seeing him a few times in the PCL late in 2010 where he looked absolutely terrible – no velocity, no out-pitch. 88mph fastball after 88mph fastball over the middle of the plate, and frankly I’m surprised he only gave up 31 runs in his 40 innings. I saw him several times in 2011 and it was clear he was throwing harder, and spotting the ball much better than he had the previous season, but it also underlined how small his margin for error is. If his 91 slips to 89, well, I remember what that looks like. Luckily, Beavan has been a model of consistency since debuting last July. His velocity chart is essentially a straight line and he displayed no loss of velocity in his start against Oakland. His average FB velocity was actually higher in the 7th than it was in the 1st inning. He’s not flashy and he’ll always have limitations, but the M’s have to love what they’ve gotten from their #4/#5 starter thus far. Here’s his velocity from his start against Oakland; compare it to Noesi’s above.
Jason Vargas’ velocity is absolutely unchanged, which is just about the most Jason Vargas result possible. No, Vargas isn’t the most consistent of pitchers, but he’s about as boring as a pitcher can be despite having a good change-up. This isn’t bad; I’ll take boring and reasonably effective over intriguing and awful any day.
Tom Wilhelmsen’s velocity is unchanged, and he’s been pretty successful. Steve Delabar’s velocity hasn’t changed, and he’s been unsuccessful. So, uh, how about that? Delabar’s HR/FB ratio is 57.1%, while Wilhelmsen’s is 0, so that’s pretty much that.
The surprise of the year velocity-wise has to be Kevin Millwood whose velo dipped under 90 MPH in his disastrous 2010 campaign and remained there in 2011 as he fought his way through the minors before popping up with the Colorado Rockies. It was back above 90 in Arlington, and his two-seamer had great movement. I thought the odds Millwood was done and would get released in March were pretty high, but he could turn into one of the better bargain pick-ups in the division.
Comments
One Response to “Comparing Mariner Fastball Speeds: April 2012 versus (mostly) April 2011”
Leave a Reply
You must be logged in to post a comment.
I think Beavan gets a little “more” out of his fastball because of two reasons. 1) he is 6’7″ and has a bit more down-angle on his pitches. 2) he remains a bit more upright with his natural follow through than a lot of pitchers, further pronouncing the advantage of having a bit more down-angle than most. Just an observation. Plus, he has a pretty good idea what he is doing and is confident enough to trust it.