
Now these points of data make a beautiful line…
DMZ · October 16, 2007 at 11:23 pm · Filed Under Mariners
Mariner run scoring and prevention in full seasons since moving into Safeco Field
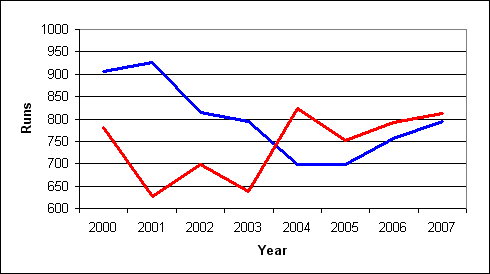
Runs scored in blue
Runs allowed in red
(yes, the title’s another Portal reference. No, I will not stop with the Portal references)
Comments
39 Responses to “Now these points of data make a beautiful line…”
Leave a Reply
You must be logged in to post a comment.
Good graph Derek. Thanks for posting it.
What jumps out at you immediately (besides the dominance of the 2001 squad) is that our run prevention in 07 was nearly as bad as it’s ever been in Safeco. Additionally, while our run differential has improved each of the last two years, it has been in very small increments which suggest we are not nearly as improved since 2005 as our record would indicate.
I know that these are things we pretty much already knew, but this graph drives the point home, for me at least.
Ahhhhh, 2001. *sighs*
Thank God this is just computer data, and doesn’t have anything to do with the REAL game of baseball.
*more sighs*
The Mariners should replace the Moose with a Weighted Companion Cube. Team morale would improve drastically.
As would attendance Matt, as would attendance. Heck I would go just to see my good friend again. Thank you DMZ during this time of baseball sadness it is good to come and see portal until the inevitable free agent and trade blunders.
That run prevention spike (or dip, depending on how you look at it) from 2003 to 2004 really stands out. Wow, what happened to our rotation? Let’s see, 2003 was Garcia, Moyer, Meche, Franklin, and Pineiro. 2004 was Garcia, Moyer, Meche, Franklin and Pineiro (at least until the wheels fell off – followed shortly by the axles, undercarriage, oil pan and crankshaft). Hmmm. Odd, it was the same staff, more or less. What could have possibly been the reason for the sudden jump in runs allowed?
Must’ve just been bad luck or something.
On a completely unrelated note, through the magic of XM, I was listening to the Cleveland announcers for part of the game today. I caught this snippet “So, with the flyball pitcher Byrd on the mound, you go with the good outfield defense…”
JMH: replacing Cameron with Ibanez certainly was part of it. As well as replacing Cirillo/Guillen with Spiezio/Aurilia, Boone’s decline, Moyer developping a case of Gopheritis and Garcia leaving mid-season.
Portal is an amazing game. Please, reference it constantly. If nothing else, the game makes you think in different ways. Hell, it’d do a lot of people some good.
TheEmrys basically made the post I wanted to.
I wasn’t going to buy The Orange Box but got talked in to it by some people last weekend to play TF2. I ended up playing through Portal on Sunday – what an amazingly interesting and clever experience.
I am not good at these new fancy numbers like run prevention and scoring, but the lines go up since 2005 so Bavasi must be doing a good job!
Ugh… That graph depresses me. Think we can only wish for luck to have that little blue line cross the red one anytime soon. A lot of that relies on who is playing on the sides of Ichiro next year.
hmm. think a nice, clean, easy to read, multi-colored graph get the point across in the Big Boardroom?
I haven’t had the opportunity to spend much time with Portal yet. I’ve been too busy poking people with pointy metal sticks (recently took up fencing).
If I keep seeing all of these references, I’ll keep being reminded I need to get into it.
TF2 is a ton of fun though.
Oh, and nice graph. 🙂
is there any sort of colorful graph to illustrate that it is now down to just four ‘never been’ teams … the DRays, the Natpos, the Rangers & the M’s?
12: any guesses as to who makes it first, the DRays or the Ms? Sadly, I’d have to put my money on the Rays.
You could put down money for who’ll make the PLAYOFFS next…
Mariners 2007: HUGE SUCCESS
[Pineiro]
Correction: I meant 2005 rather than 2004 in the Bavasi quote.
What the hell happened to our defense between 2003 and 2004?
For years I’ve been firmly convinced (the 2001 playoffs exit sealed it in my mind) that the day will come in my lifetime when the M’s are the last team in Major League baseball never to have played in a WS. The Las Vegas Somethings and the Portland Whatevers will play in the WS before the Mariners.
Once the Cubs get their rings, the M’s will be the team to carry a “curse.”
#19: I wouldn’t go that far, I’d be more inclined to say right now Texas or Tampa and possibly even Washington will be the last ones to get there over Seattle.
Well, here’s a try at a filk:
This wasn’t a triumph.
I’m making a note here: HUGE SUCK-ASS.
It’s hard to understate how bad they failed.
Mariners Baseball
They do what they do
because they’re dumb.
For the good of the none of us.
Except the ones who own them.
But there’s no sense crying over all their mistakes.
They just keep on trying till they run out of cake.
And the baseball gets done.
And they make a nice run.
For the people who still pay full-price.
I’m not even angry.
I’m being so sincere right now.
Even they you broke my heart.
And Adam’s.
And traded for Vidro.
And called Rick White out of the pen.
As he bombed it hurt because I was enjoying the run!
Now these sabermetrics make a beautiful line.
And they’re out of contention.
Their tee time’s at 9.
So I’m glad. I got burned.
Think of all the things we learn learned
for the people who still pay full-price.
The season is over.
I think I prefer to curl up and die.
Maybe they’ll find decent arm to help them.
Maybe Santana
THAT WAS A JOKE.
HAHA. FAT CHANCE.
Anyway, this dust is great.
It’s so bitter-tasting and dry.
Look at me still whining
when there’s an off-season to do.
When I look at the Rocks, it makes me feel really blue.
I have Portal to play.
Buy the Orange Box today.
And you better be paying full-price.
And believe me I did pay full-price.
Adam Jones, he paid full-price.
HoRam and Weaver, they paid full-price.
Veteran leadership, they paid full-price.
Lolla-blue-za, they paid full-price.
FULL PRICE
With all the discussion made about how Bavasi and M’s have the best improvement over the past 5 years (winning %); I’ld love to see it broken down by RS/RA differential and cost per win, and see how well our improvement rates compared to other teams. It “feels†like we are severely overpaying for our record, and I really hate using the term “feelsâ€; when I would rather have some stats to back it up – but can’t seem to find them anywhere.
I would just love to see our cost/win graph next to say the Rockies or Indians.
21: Awesome.
Um… what stats are you looking for that you can’t find? baseball reference has RS/RA, and the USA Today Salary link up there has the payroll data. Go forth and break it down.
Since I have this in a spreadsheet already, here they are for 2007. Note that while the top of the list doesn’t change much over the past few years, there’s a fair bit of fluctuation in the middle: SF, Cin, Hou, have all been higher than SEA in the recent past; Ari was higher in 2001 and 2003, Cle was higher through 2001, and even Col was higher in ’99 and close to the M’s in the years right before and after that.
$/Win 2007
NYY 2.63M
Bos 1.99M
LAA 1.46M
NYM 1.36M
STL 1.33M
LAD 1.31M
ATL 1.27M
PHI 1.26M
CHW 1.23M
SEA 1.20M
TOR 1.05M
CHC 1.04M
SFG 1.03M
KCR 1.02M
DET 1.01M
CIN 1.00M
HOU 1.00M
BAL .97M
TEX .96M
OAK .88M
MIN .85M
MIL .79M
CLE .74M
SDP .71M
COL .69M
ARI .55M
PIT .53M
WAS .51M
FLA .40M
TBR .27M
Nice post, Joero.
It’s telling to see that the two likely World Series teams both spent less than $1 million per win.
Are you paying attention, Bill?
Thanks DMZ, was having no luck with google, maybe I’m just being slow today. Completely forgot the links on the side.
Just put it together for this year and it’s not as bad as I thought it would be. 7th highest priced team, 8th most x win. $18.5M more this year than last year to improve 10 games.
I think what’s more interesting is looking who made the play offs and how much they paid per Win. Clev, Col, AZ ranked as the 24-26th; NYY & BoSox 1 &3; Chi C, LAA, and Phili from the middle.
It’s telling to see that the two likely World Series teams both spent less than $1 million per win.
Yes, well on the flip side the #s 1-3 all made the playoffs and #4 just barely fell short after a fairly substantial collapse. #5 is last years WS champs.
For a split second I thought this was a baseline report parody.
on the flip side the #s 1-3 all made the playoffs…
This is similar to the Organizational Rankings discussion of the other day.
The top 5 highest payroll teams in 2007 either made the playoffs, or nearly did. But teams # 23, 24, 25, 26 in payroll also made the playoffs (if you include San Diego), while two mid-payroll teams made the playoffs.
So, both payroll and how well a team is run are important. Dave ranked all teams based on his opinion of which were the most well-run. I calculated some Winning Percentages based on both Dave’s ranking of quality of management and on payroll.
The top one-third of “Well-Run” teams 2006-7 combined Winning Percentage: .520
The bottom one-third (“worst-run”) teams 2006-7 combined Winning %: .466
Payroll was not a big factor; payrolls were similar between these two groups, averaging $86 Million vs $78 Million for 2006-7 combined. Dave’s well-run teams are basically equally distributed among both low and high payroll teams; similarly, the poorly-run teams have nearly equal numbers of high and low payroll clubs.
Looking at payroll alone, regardless of how well-run the teams are, the differential between the biggest and smallest spenders averaged across 2006-7 is not quite as big:
2006-7 Win. % for top one-third highest-payroll teams: .519
2006-7 Win. % for bottom-third lowest-payroll teams: .472
Looking at the 10 playoff or near playoff teams (counting SD and NYM):
Well-Run:
6 were top-third “well-run” teams
1 was a bottom-third “worst-run” team (3 were middle-third well-run teams)
Payroll:
6 were Hi-Payroll Teams (top 10 payrolls)
4 were below-50th-percentile Payroll Teams
Looking at how many teams in 2007 made or nearly made the playoffs based on the combination of how Well-Run and High-vs-Low Payroll:
3/5 Hi-Pay, Well-Run teams made playoffs
3/10 Hi-Pay, Average- and Poorly-Run teams made playoffs
3/6 Lo-Pay, Well-Run teams made playoffs
1/9 Lo-Pay, Average- and Poorly-Run teams made playoffs
So, higher payroll teams do win more. But well-run teams win even more, regardless of payroll.
The only poorly-run team to make the playoffs in 2007 was a high-payroll team (Philadelphia). Not one low-pay, poorly-run team made it.
The Mariners, as you know, were Hi-Payroll, Poorly-Run.
My apologies for failing to close the italics after the opening quote.
I am just wondering. I might’ve missed the announcement, but does the tagotron automatically delete my comment if i say a certain word? I am sorry but my comments keep getting deleted and i think its because i keep mentioning jp in st louis. Or does Derek just not like me?
Take a clue from the notes: you keep spelling words wrong that traditionally get your comment nuked. Lou Piniella’s the most prominent, but broadcasters, players….
…such as this jp guy…
Alright, thanks Derek. I’ll be sure to check my spelling before every post now on as well as the content.
Not at all the point, though obviously USSM has a pretty low tolerance for many errors, and seeing effort in comments makes me happy.
It’s that there’s a convention around people’s names, and silly or not, getting Jo-El’s name (or spelling it “Rick Rizz”) gets your comment nuked with a bracketed spelling correction unless the mods have an enormous amount of time to fix it.
Just remember, all that you have to represent yourself online is the text that you type, and someone who chronically has bad spelling and grammar is akin to that guy who talks as if he always has a mouthful of food.
(not necessarily saying you’re that guy, just using it by way of example)
I’m sure you have some good things to say, but if your posts are difficult to read, people generally won’t take the time to figure it out.
Max Power, and Jeff Nye wrote:
I’m not sure this means as much as most people think it does, because baseball doesn’t have a true free market for talent. Good, young teams are artificially cheaper than they might otherwise be, because teams can control good young players for an artificially cheap salary for six years – at least the first three years (before arb-eligibility) will be cheap, and usually the first year of arbitration as well. So, there will often be a 2-3 year lag between when good, young, cheap team becomes a good, less-young, spendier team – assuming the team has the resources to keep that team together once they have to get paid.
Of course, this doesn’t excuse the Mariners, who’ve sucked (and then sucked a little lsss each year) while spending gobs of money. But it does skew the analysis a bit. You’d be better off looking at marginal wins/$ over rolling 4 or 5-year periods, I think, to get a more accurate picture.
Probably ended that post a bit earlier than I should have. To illustrate my point, both Cleveland and Colorado have been good, high marginal $/win teams in the fairly recent past, and are cycling back toward low marginal $/win teams as they re-build with younger players. In the not-too-distant future, their $/win will go up pretty dramatically, unless they progress to win at some outrageous, 2001 M’s-like rate.
Well, at least from my perspective, it wasn’t intended to be authoritative; it’s just good to note that spending more money doesn’t always equal more wins.
There are always other factors, as you rightly point out.