
Safeco Field in 2016: Mental Park Effects
One of the striking things about the Mariners’ first half of 2016 has been the sharp increase in the number of HRs M’s pitchers have given up. If you’ve followed the baseball news today, you know that this isn’t just some M’s specific phenomenon: commissioner Rob Manfred addressed the league-wide HR rate increase, and denied that it had anything to do with PEDs or the baseballs themselves. So HRs are up overall, but no one’s quite sure why. For the M’s, though, what’s striking isn’t just that their HR rate is up – it’s that it’s higher at Safeco than it is on the road. Is Safeco Field a pitcher’s park anymore?
The answer to that question depends on what you *mean* by the phrase “pitchers park.” Park factors have long been calculated by looking at how a team fares at their home park compared to how they fare on the road. Ideally, you’d build in adjustments for the quality of opposition, the unbalanced schedule, regression, etc. If you want to keep it simple, you’d just look at run scoring in one environment versus another, without getting into the specifics of how those runs scored. Alternatively, you’d slice and dice them into components, with different factors for righties and lefties, or however else you want to do it. Still, it’d be based on looking at results in one place and comparing them to results in other places.
Now that we have Statcast, though, you can drill a layer deeper and look at what happens to *nearly identical batted balls* in various places. Forget defense, or context, or a pitcher’s approach, Statcast can reduce park factors to an applied physics problem. A batted ball in Seattle is traveling at speed X at launch angle Y – what are the odds it goes for a dinger? Take the same initial speed and angle, but substitute Arlington for Seattle…then what? Looking at Statcast data, Safeco appears to be a “pitchers park” if the question we’re asking has to do with how a batted ball flies through the air. The marine layer, lower temperatures, power alley dimensions all add up to make a 100mph fly ball a bit “worse” in Seattle than it is in Texas.
And if we look at “old” park factors, especially ones that are based on runs allowed, we see the same thing. Despite pulling in the fences before the 2013 season, teams score fewer runs in Safeco than they do on the road, in large part because it’s harder to hit doubles in Seattle than in other places. The M’s But if there’s anything that this year tells us, it’s that park factors are much, much more than an applied physics problem. If a team *plays differently* in one park than another, then that will show up in the park factor, and that difference in approach has nothing to do with Statcast data, nor with outfield dimensions. The M’s pitchers have given up more HRs in Seattle than the road despite the fact that they’ve pitched fewer innings at home. While other things may have played a role, the Mariner pitchers seem to have made Safeco play like a HR-friendly ballpark.
I say this because it’s not just a (slight) difference in HR rate, but because the M’s approach overall seems different at home. The M’s K-BB% at home is 17.4%, 6th in baseball. On the road, it’s just 11.2%, or 18th in the league. The league rate overall is better at home and worse on the road, but the gap is much smaller and the teams that are generally good at home are really good, albeit just not quite AS good, on the road. The M’s K-BB% at home is excellent – far above the league average for home teams. On the road, they’re just average to a bit below compared to the average for road teams. At home, the M’s go right at hitters, and rack up far more Ks than they do on the road, where their walk rate starts creeping up.
Their batted ball profile looks different, too. At home, M’s pitchers have given up the third-highest fly ball rate at 38.6%, but they’re down in 19th in ROAD fly ball rate. Their approach at home not only gets them more strikeouts and fewer walks, it also gives them infield fly balls – they get fewer pop-ups on the road. This could be nothing – the differences aren’t huge, and we’re talking about a half a season. But if you were looking for evidence of a coordinated strategy, it’d look a lot like this.
One way to think about this is to look at a specific pitcher, and the M’s have the textbook example in Wade Miley. Miley spent last season (and really his whole career) pitching in hitters’ parks, and he’s had some HR issues in the past as a result. This year, he was moving to a park that’s suppressed runs – would that play into his approach? Miley’s given up 9 HRs at home to just 6 on the road, despite facing 60 more batters on the road. His K-BB% at home is over 13%, but just 6.1% on the road. His home FB% is right at 40%, but just 29% on the road. How does this happen? Because he’s throwing a lot of high fastballs at home. Here’s a heatmap of Miley’s 2016 fastballs overall:
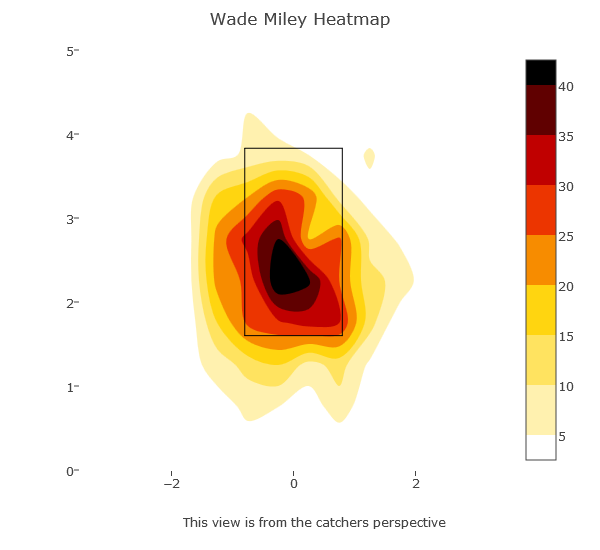
There’s a big blob between 2′-3′. Now, take a look at Miley’s heatmap for HOME fastballs:
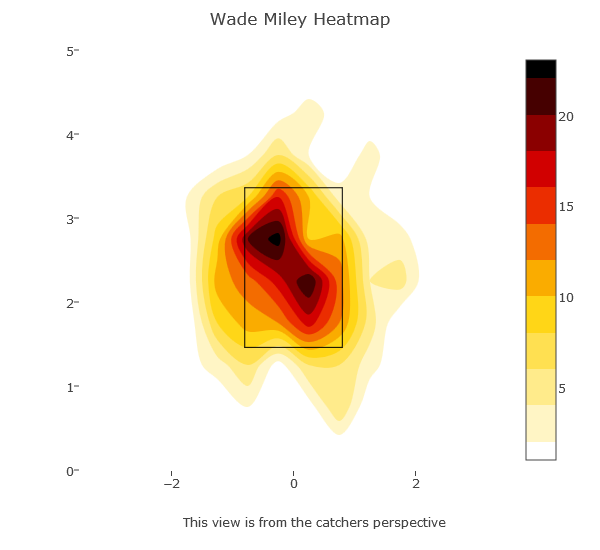
Look at the concentration of high FBs, on the inside part of the plate to righties. Miley is pitching differently at home, and the results are kind of a mixed bag. If you just look at the slash line he’s given up, he’s been better at home. Sure, the SLG% is too high, but it adds up to a .333 wOBA, a hell of a lot better than the .366 he’s given up on the road. But by FIP, he’s been better on the road, where the lower HR rate counts, whereas his very good home BABIP doesn’t. Despite that overall wOBA gap, there’s a case to be made here that Miley really shouldn’t be targeting the upper reaches of the strikezone. From 2012-2015, Miley pitched in some very difficult parks, but kept his FIP below 4 in part because of a strong GB%, that occasionally topped 50%. It’s down at 45% this year, and the low HOME rate is the reason why. Miley’s pitched down for his career, and while he’s still given up HRs, he’s obviously been solid enough with his approach to be a league-average or better starter.
This reminds me of our discussion of Jon Niese, or this great Neil Weilberg piece about the new Pirates pitcher. In Niese’s case, he still a GB pitcher with the same fastball, but he’s giving up a lot more HRs this year. He’s also throwing his FB *lower* than he ever did with New York. Low fastballs are great, and Ray Searage has helped plenty of pitchers succeed with this approach, but he and Miley may be examples of pitching coach overreach – maybe it’s better to let a pitcher stick with what’s worked rather than try to tailor a pitcher to his ballpark. Maybe it’s best to target pitchers who know and trust their approach, and not target park effect arbitrage opportunities.
So the M’s look different at home – do other teams do this? The other team that comes to my mind is another AL West club that plays in a marine layered stadium: the LA Angels. It’s hard to tell this year with Garrett Richards hurt and Jered Weaver on life support, but the Angels have been a great example of a team altering their approach at home to get better results than they would overall. Their overall K rate is so low, but their K-BB% is mediocre at home, and abysmal on the road. This is something we’ve talked about before – this 2015 preview piece noted the Angels’ ability to avoid HRs at home. For the three years spanning 2013-15, the Angels ranked 23rd in home HR/9, but 5th on the road. The same pattern appears with K-BB%, albeit shifted lower – their K:BB ratio, the walk rate, everything looks a lot like what the M’s have done this year, with one, huge, exception. For the Angels, this approach worked WITHOUT a spike in HRs. The M’s adopted the Angels approach, but their own home park hasn’t prevented fly balls from finding seats.
Given the Angels experience, it’s easy to try to connect this to Jerry Dipoto – he was the Angels GM during that 2013-15 time frame. I have no idea if that’s true or not, or if this is just a common strategy for handling a staff full of fly ball pitchers. If there’s anything we DO know about Dipoto, it’s that he seems to like getting fly ball pitchers. Still, it’s tempting to see the combo of K-BB% improvement and HR rate issues as connected with his bullpen strategy – the M’s picked up some pitchers who looked good by K-BB%, but gave up too many HRs. Maybe the thought was: just stick them in Safeco, and you’ll get all of the good with 1/2 of the bad, the same way you stick Matt Shoemaker in Anaheim and he’s great (career 3.07 FIP), and you just hope he can keep the team in the game on the road (4.77 FIP away). What seems to be happening is that Safeco’s no longer the HR-suppressing park that Anaheim is. That’s shown up in HR park factors, of course, but again, what matters is how pitchers think about a park. The M’s hurlers are pitching in Seattle the way Anaheim’s do in Anaheim, and that has a certain set of consequences.
To be clear, we’re talking about a half-season of data, and the rates are really close. For every Wade Miley, there’s a Nate Karns, who’s got a better K-BB% on the road, with fewer dingers. So it’s possible that this is just luck, or that it was driven in part by guys who aren’t here anymore, like Joel Peralta (and the gap between home and road K-BB%, HR/9, etc. were much more striking a few weeks back when I was first looking at this). It’s also possible that the M’s really just give up tons of HRs, and it’s only some other factor that’s suppressed their ROAD HR/9 – something like the unseasonably cold spring in the upper midwest/northeast that Tony Blengino talked about back in May. Maybe some difference in the line-ups they’ve faced is driving this – lots of patient hitters on the road, lots of Mark Trumbos at home, somehow. I wonder if batters have made some adjustments to high fastballs league wide, or that teams are now selecting more for high FB hitters after pitchers found success getting batters to swing under high fastballs? And I ought to reiterate: despite the homers, the M’s have fared a bit better at home, thanks to that great K-BB% and Seattle’s continuing doubles dearth. Their ERA’s under 4 at home, and their FIP’s significantly better, too. Whatever the cause, and however much it’s the result of planning and not dumb luck, it’ll be fun to follow the rest of the way, and to try to ferret out any shifts in approach.
Comments
One Response to “Safeco Field in 2016: Mental Park Effects”
Leave a Reply
You must be logged in to post a comment.
Can’t let this go without anyone making a comment. Nice write-up. I was thinking about this a couple weeks ago when Danny, Dave, and Moore had a meteorologist on the show to talk about the “marine layer” and why more homers have been hit at Safeco this year than any other year. The meteorologist said exactly what I was thinking in that maybe it’s just that the M’s have better players now than they’ve had in the past. In reading this analysis, I’ve amended my thinking that it’s probably a combination of better players and pitchers thinking they can pitch up more in Safeco, “the pitchers park.” I haven’t looked at the numbers, but in the past haven’t opposing teams not really had any problems hitting homers at Safeco?
And BTW, the marine layer argument is pretty much bogus. In fact, in more humid conditions the ball will actually fly farther, but in colder weather it will travel less. Humid air creates more buoyancy, colder air has tighter atoms (thicker). And even so, on the coolest days the ball won’t die any more than around 3 feet.