
Yet Another Update on Safeco Field, Home Run Haven
I mentioned it in the last game thread, but like most of you, I’ve been really confused by the fact that Safeco Field’s seen the most HRs hit in baseball. Seriously – more than Coors Field, more than Boston, more than Arlington. Safeco Field, once a park that absolutely destroyed fly ball contact, particularly to left field, is suddenly a launching pad. Just as I was trying to wrap my head around *that*, I read Tony Blengino’s batted ball park factor articles at Fangraphs, wherein he used actual batted ball data to make the claim that Safeco was still a pitcher’s park; sure, lots of balls had been hit out of the park, but if it wasn’t for Safeco’s fly suppressing ways, it’d look even MORE like Coors Field, circa 2000.
This implies, as I wrote back in July, that batters make a lot more “good” contact at Safeco. I wondered why that might be, and investigated a couple of hypotheses that…well, they didn’t work out. Then, this week, MLB.com and saber-luminaries Tom Tango and Daren Willman introduced a new metric for extremely well-struck batted balls, the Barrel. Essentially, these are batted balls that combine exit velocity (speed of the ball off the bat) with the launch angle (angle of the ball off the bat) such that the minimum expected slugging percentage is 1.500. This combination of speed and angle accounts for the majority of home runs, and while there are some fly outs in the group, the league is batting .822 on these things this year. Instead of setting somewhat arbitrary cut-offs at 100mph (lots of ground balls qualify) or just looking at fly balls (who cares about shallow pop-ups?), this definition focuses on the balls that do the most damage.
If Safeco Field sees a ton of HRs, and yet ALSO rates poorly in the percentage of 100mph fly balls that go over the fence, we’d need to see a LOT of ‘barrels’ in Safeco. And we do! Safeco ranks 5th in MLB with 266 barrels, just behind Target Field in Minnesota:
| Barrels | player_id | total_pitches | pitch_percent |
|---|---|---|---|
| 312 | ARI | 24078 | 1.3 |
| 291 | DET | 21402 | 1.36 |
| 274 | TOR | 22270 | 1.23 |
| 270 | MIN | 23926 | 1.13 |
| 266 | SEA | 22981 | 1.16 |
That final column is a rate stat – the percentage of total pitches that’ve been barreled up. Here, Safeco leapfrogs Target Field (though it’s only 6th in MLB). As you might expect, the *results* on barrels vary pretty widely by park. Parks like Coors and Fenway not only see a lot of HRs hit, but those ‘barreled’ balls that stay in the park tend to go for hits – in Coors because the park is physically gigantic, and in Boston because of the odd dimensions/Green Monster – the BABIP on these hits in Coors is .783, and it’s .733 in Boston. At the other end of the spectrum is Detroit, where the BABIP is just .364. In Safeco, it’s just .418.
In Safeco’s case, the culprit here’s one we’ve know about, though I didn’t know it was this important: it’s essentially impossible to hit a double in Seattle. Just 31 ‘barrels’ went for doubles or triples in Safeco, almost *one-third* the number that fell in at Chase Field in Arizona. Arizona obviously gets a ton of barrels – even more on a per-pitch basis than Safeco -thanks to some good hitting and so-so pitching, but the range of outcomes after that is more varied. In Seattle, a barrel has a much better shot of going for a HR than it does in Arizona (or Detroit). This table shows the parks that’ve seen the most ‘barreled’ HRs, and the fraction of ‘barreled’ contact that’s left the park. Seattle’s seen more such HRs than any other park, and it’s well above the league average in the fraction of barrels that end up as HRs (league average is 59.2%):
| Barrels | player_id | HRs | HR Pct. |
|---|---|---|---|
| 266 | SEA | 175 | 66% |
| 312 | ARI | 174 | 56% |
| 260 | BAL | 172 | 66% |
| 240 | TEX | 165 | 69% |
| 270 | MIN | 155 | 57% |
That measure, the fraction of really well-struck balls that turn into HRs, makes for a pretty handy HR park factor, I’d say. You’re already controlling for quality of contact, and if some combination of bad hitters or really good pitchers suppress HRs, well, that’d show up in fewer barrels, too, I’d think. By this ‘barrel’ ratio, Safeco looks like a strong HR park in 2016, which is good, because, you know, all of the home runs that’ve been hit there this year. It’s not the best, though. Yankee Stadium’s seen 72% of the barrels leave the yard, and that shouldn’t be a big surprise, as Yankee Stadium rates as a strong hitters park no matter how you run the numbers. At the other end of the spectrum is AT&T park in San Francisco, where just 41% of barrels have left the yard, and where teams have hit 70 2Bs+3Bs. Kansas City’s seen a ton of barrels, and on a rate basis, more than Safeco, but just 50% have left the yard.
That said, there’s another way of looking at this: how many NON barreled shots turn into HRs? If plenty of mis-hit fly balls or low line drives go for HRs, it’s probably a good hitter’s park. Here, parks like Boston (duh), Houston and Cincinnati (which has seen *80* non-barreled HRs) come to the fore, while Seattle falls to below average. 23% of all HRs have been these non-barrels. In Safeco, only 21% of non-barrels have left the yard, and it’s just 13% in Oakland. You get some oddities, like Texas and Arizona coming in below Safeco, so I’m not suggesting this is a great measure, but it complicates things a bit, and shows a bit more how taking a different look at batted ball data could produce a very different conclusion.
Another way of looking at this is just using home/road data for the M’s line-up. The M’s line-up has produced 268 barrels after Cruz’s 2 last night, with 52.2% coming at home (just 49.5% of their total PAs have been at Safeco thus far). For the pitchers who’ve played for the M’s all year, the fraction’s similar – a bit more than half of the best-struck balls have come at home. This doesn’t really prove anything, but it’s consistent with Safeco being a park that somehow generates or facilitates or encourages barreled balls. We still don’t have an explanation for WHY, but it’s fairly consistent with the original hypothesis that the M’s pitch *differently* at home, perhaps thinking the park will bail them out. The M’s K-BB% is much better at home (15.6%) compared to the road (11.8%), suggesting that they attack batters a bit more, generating more K’s and fewer walks. But they’ve paid a price in HRs, as evidenced by their 1.44 HR/9 at home to just 1.22 on the road.
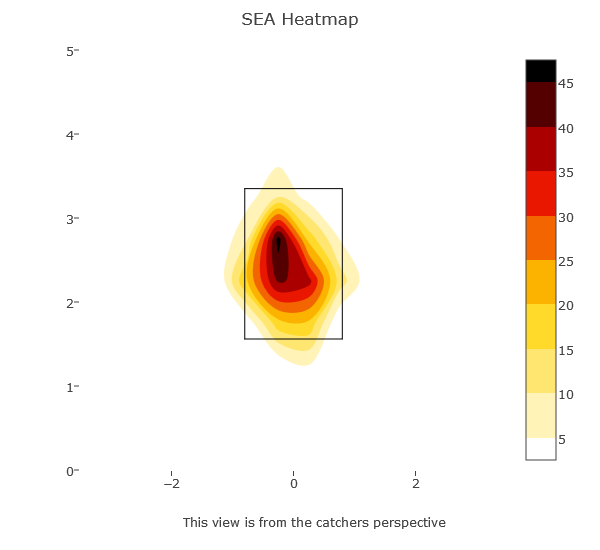
Interestingly, the pitches that have generated barrels are somewhat different at Safeco. Here’s a pitch heatmap for the 266 barreled hits in Seattle – you’ll notice that they peak middle-up in the zone. It’s not high enough to be a ‘high strike’ that I looked at back in July; these are at the top edge of the middle of the zone:
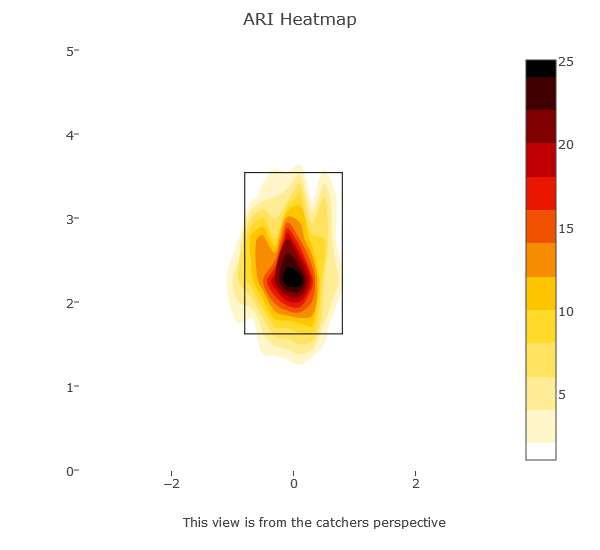
Compare that to Arizona, where batters have most often barreled up pitches at the *low* end of the center of the zone:
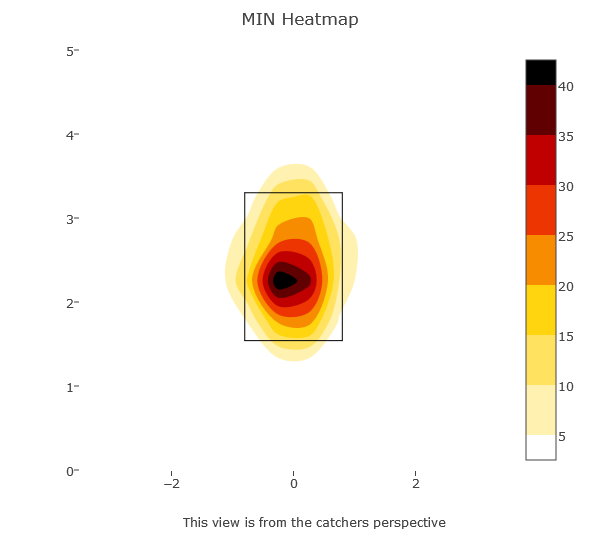
Minnesota’s more purely middle-middle, but again noticeably lower than Seattle:
M’s pitchers have tended to throw more low strikes, but these high (but not TOO high!) pitches have really been hammered in Seattle. It’s tempting to connect the higher average pitch with the higher-than-average ratio of barrels to HRs, but remember, the launch angle on ALL of these pitches is consistent with long fly balls.
Moreover, this doesn’t appear to be a 2016 phenomenon. In 2015, there were a lot fewer barreled hits overall- just 0.88% of pitches became barrels last year, compared to 1.03% this year. But Safeco was far above average in both years, coming in at 1.01% last year and 1.16% this year. While much of the discussion of Safeco’s HR issues this year has centered on the dimension changes making things easier for right-handed bats, Safeco seems to generate more barrels for *lefties* than righties. Not sure what to make of that.
So where are we? I’d say that these data challenge the notion that Safeco’s still suppresses fly balls. More of the best-contacted balls are hit at Safeco, and when they are, more of them become HRs than in other parks. Safeco may still be something of a pitchers park because it’s very difficult to hit doubles there. But even more than that, it plays like a pitcher’s park because the M’s (and their opponents I’d guess) walk fewer batters and strike out more. This seems like a difference in approach more than something to do with the park itself, but whatever the cause, it’s still somewhat more difficult to score in Safeco than elsewhere. It’s NOT, however, a park where HRs go to die. Whether that’s due to the same shift in approach, a shift in the marine layer, or a shift in the ball still isn’t clear.
I mentioned it above, but I want to reiterate just how much things have changed from 2015. That jump in the percentage of pitches that turn into barrels is pretty remarkable; teams have already hit more than 800 more barrels than in all of 2015. And slightly more of them have become HRs – 59.2% vs. 58.5%. The jump in some parks is also remarkable – Detroit going from 1% to 1.36%, Baltimore from 0.98% to 1.15%, etc. The increase in the percentage of barrels that leave the park is certainly consistent with a juiced ball, but the rest of it seems like a difference in approach, though one could argue that a juiced ball would lead to higher exit velocity and thus more ‘barrels.’ None of this is dispositive, but it’s an interesting way to look at what’s happened in Safeco this year, and it bears watching in the future. ‘Barrels’ are a really interesting way of looking at quality of contact, and they hold the promise of helping improve swing paths as well as merely describing events.
Comments
One Response to “Yet Another Update on Safeco Field, Home Run Haven”
Leave a Reply
You must be logged in to post a comment.
Marc, this is interesting. But having read it through twice my only comment is that I think Tom and Daren have to find a few more parameters to make barrels relevant.