Game 156, Mariners at Angels
Hisashi Iwakuma vs. Jered Weaver, 12:35pm
One of the tired cliches of meaningless September baseball is that a team can play “spoiler” – that they have an opportunity to impact a playoff race that they themselves aren’t involved in. The verb feels odd, like this spoiling business is a game or musical instrument, and it’s never clear if this is a nice consolation prize or some awful baseball purgatory: watching others experience what you and your teammates can’t. Does it have to be forward-looking, or can the M’s look back on their season and identify spoilering back in, say, May? I bring it up because, despite their strong second half record, the M’s have brought joy to several teams in recent weeks. While they delayed the inevitable by a day, they were the opponent the Royals clinched the AL Central against. And now, they’re keeping the wild card chase pretty interesting, bringing the Angels to within a half-game of Houston and keeping them there last night. This is the necessary opposite of the “spoiler,” and because the M’s face Houston after this series, they will either spread joy again or, if you prefer, spoil their previous spoiling.
Instead of having a role in deciding playoff teams, most M’s fans are interested in this one because of the Angels’ starter. 11 days ago, Weaver was ejected after plunking Kyle Seager following a testy exchange as Seager settled into the batters box. I’ve been a bit surprised to see how many people saw this as a case of Seager trolling the competitive Weaver as opposed to Weaver picking a really odd thing to get pissed off about. In any event, it doesn’t sound like there’s any residual animosity here, so I doubt we’ll see an encore or an escalation, though I really hope Seager homers so we’ll get a chance to test that hypothesis.
1: Marte, SS
2: Seager, 3B
3: Cruz, DH
4: Cano, 2B
5: Montero, 1B
6: Smith, LF
7: Morrison, RF
8: Miller, CF
9: Hicks, C
SP: Iwakuma
The Angels seem to struggle against splitters, which bodes well for Iwakuma today. LoMo as an outfielder, however, does not. Thankfully, Iwakuma’s a ground ball guy.
Game 155, Mariners at Angels
King Felix vs. Andrew Heaney, 6:05pm
Happy Felix day.
After an extra day of rest, the King faces off with Angels rookie lefty Andrew Heaney. The M’s saw him in the last game of the first half, back in July, and couldn’t figure him out. Heaney tossed 7 shutout innings at the M’s, confounding them with his low 3/4 delivery and a release point that’s half way to the first base line. That should make him tough on lefties, and he is, with a FIP barely above 2 against them. As a result, he’s facing nearly 3X more right-handed batters than lefties, and with that kind of release point, you’d figure he’d really struggle against them. That hasn’t happened yet, for whatever reason. Thanks in part to a low BABIP, righties are only hitting .241/.302/.382 off of him. His FIP isn’t great, as he’s not missing many right-handed bats despite a solid change and a very good curveball.
Heaney’s running a low BABIP and an extremely low ground ball rate, which illustrates the most interesting part of Heaney’s splits. To lefties, he pairs Ks with lots of ground balls. Righties, on the other hand, hit a ton of fly balls. Both his curve and change get get sink, but while lefties swing over the top or beat them into the ground, right-handers seem to sky them. Righties have hit 11 infield flies, while lefties have hit none. This sounds like a great approach for his home park, but Heaney’s actually struggled there, giving up 6 of his 8 HRs at home.
1: Marte, SS
2: Seager, 3B
3: Cruz, DH
4: Cano, 2B
5: Gutierrez, LF
6: Trumbo, RF
7: Montero, 1B
8: Sucre, C
9: O’Malley, CF
SP: El Cartelua
Tony Blengino used Z scores and age-relative-to-league to rank minor leaguers and then rank the MiLB systems of each club. As you’d expect, the M’s finished in the bottom third thanks to the odd struggles of DJ Peterson and Alex Jackson. The top players were Ketel Marte, who, to be fair, has looked great so far, and SP Edwin Diaz who was excellent in high A and then battled AA to a draw at 21. Blengino dubs the M’s the org that took the biggest step back. The Angels actually finished behind the M’s thanks to a dearth of hitting prospects – something that’s troubled the org for a while. With Jerry Dipoto apparently a finalist for the M’s GM opening, it’s worth noting that Dipoto really struggled in the draft as head of the Halos. His predecessor, Tony Reagins, didn’t have the reputation of a great draft/player development guy, but he DID pick Mike Trout and Kole Calhoun, Randal Grichuk, Tyler Skaggs and Patrick Corbin in one draft, then Calhoun and still-sorta-prospect Kaleb Cowart in the next.
Game 154, Mariners at Angels
Vidal Nuno vs. Garrett Richards, 7:05pm
Garrett Richards makes his 5th start of the year against the M’s, and, perhaps luckily for him, dodges Felix Hernandez following the M’s rotation shake-up. Going back to 2014, when Richards became a top-flight starter, he’s faced the M’s 6 times, and utterly dominated them in 4 of those starts. Maybe it’s luck, maybe it’s the wear and tear of topping 170 IP for the first time, but his only two mediocre starts have come in his last two tries. The first four times he faced the M’s, he went 2-0 and gave up four total runs in 29 2/3 IP. With his cutter-ish four-seam and hard, hard slider, he has essentially no platoon splits. His heavy fastball produces lots of grounders, so he’s largely immune from the HR problems that have plagued some of his teammates on the road. Every indication we have is that all of those strengths are still there – he’s still throwing 97, still throwing a sinking four-seamer, and his slider still dives like an 89mph curve ball. But the M’s have touched him for 8 runs on 17 hits and 2 HRs in just 10 1/3 IP the last two times they faced him.
The biggest reason why Richards’ FIP is nearly a run higher than it was last year is that Richards’ slider is no longer untouchable. In 2014, batters *slugging percentage* on sliders was .173. They hit zero homers and just four doubles on the nearly 800 sliders Richards threw. This year, though, they’re slugging .358 on 943 sliders, with 18 XBH including 8 dingers. To be clear: it’s still a very good pitch, and Richards has probably been somewhat unlucky on the pitch this year, but it illustrates how regression comes for every player *and every player strength*. Richards’ slider was gold in 2014, and nothing gold can stay. So is that the answer to the M’s recent run of form against the Angels’ ace? Surprisingly, no. The M’s were always completely undone by Richards’ fastball, and that’s the pitch they’ve seemingly learned to hit.
In his first 3 starts against the M’s, he posted pitch type linear weights, or the run value below average, of about 8 runs in total (I’m combining Richards’ sinker and four-seamer here) while his slider was 3.4 runs better than average. There are many reasons why pitch type linear weights isn’t the best metric here, in that it’s a counting stat and he threw more FBs and balls “hurt” Richards, and he’s more likely to throw the slider for a ball. But in this case, it illuminates the problem the M’s had with his fastball. Richards threw a *ton* of sliders in this 3 game sample, throwing 47 of 98 pitches in a game in 2014, for example, so while he threw more total fastballs, it’s not like he threw 80% FB/20% sliders. But look what’s happened to his run value in his LAST 3 starts against the M’s: it’s 3.3 runs BELOW average. His slider has dropped too, but it isn’t as dramatic.
As Richards is almost absurdly consistent, there doesn’t seem to be any change in *how* he uses his fastball. Here, for example, is a graph of his horizontal pitch location this year. This graph *should* be volatile, and it’s not. There are more peaks and valleys on the vertical location chart, but there’s been no change in approach. It this the M’s making an adjustment? I’d like to think so, just because evidence of them adjusting just about anything that isn’t working is so often hard to find. But we’re quickly reaching the outer limits of what I can gin up by looking at free data; the M’s aren’t whiffing on his FB now, but then, they didn’t too much before. They’re turning strikes into balls in play, and balls in play into hits, but that’s always the noisiest part of the data. Maybe they’ve figured out the pitch’s odd movement, maybe they spotted some sort of tell (his vertical release point for sliders is a tiiiiny bit higher than it is for FBs), or maybe the batters’ eye at Safeco’s really good. Maybe it’s just that his most recent starts occurred when the M’s offense has been legitimately good. Whatever it is, may it continue tonight.
1: Marte, SS
2: Seager, 3B
3: Cruz, DH
4: Cano, 2B
5: Smith, LF
6: Trumbo, RF
7: Morrison, 1B
8: Miller, CF
9: Baron, C
SP:
A depressing note from Joe Sheehan regarding King Felix. In a free preview of his subscription newsletter, Sheehan noted a year ago that Felix has the highest WAR of any active player who’s never played in the playoffs, and it’s not close. At the time, Felix had a 10+ WAR lead over Brian Roberts, who then retired (and technically, Roberts played a tiny bit on the 2013 O’s team that went to the playoffs, though of course Roberts wasn’t on the playoff roster), a larger lead over Mike Trout and Alex Rios. Mike Trout made the playoffs last year, and Rios is headed there in 2015. It’s not just that Felix leads this sad group, it’s that so many of the group get disqualified every year once their clubs break their playoff droughts. We always say that Felix stands alone, but this is a particularly sad verification of it.
The Red Sox today hired ex-Braves GM Frank Wren as a senior VP for baseball ops, which means their front office is now even more crowded than it was. Despite firing GM Ben Cherington earlier in the year, the club now has a President of baseball operations, a general manager, and now Wren. Gordon Edes says the hierarchy is Dave Dombrowski (President), then Mike Hazen (the GM), and then Wren (Senior VP). But the club now has 4 “Senior VPs” within the same division and it’s not clear at all how they divvy up the work. Along with Allard Baird, there are fully 4 GMs/ex-GMs on staff, and 28 total VPs throughout the org (plus another with Fenway Sports). I know there’s a trend towards hiring “President” types above GMs, but this seems unparalleled.
Game 153, Mariners at Royals
James Paxton vs. Johnny Cueto, 5:10pm
We’re under ten games to go in 2015, and the M’s technically haven’t been eliminated yet, which is…no, it’s not much of anything, but I suppose it’s better than the LAST time national experts thought the M’s would be contenders. That year, 2010, was one of the most dispiriting campaigns in M’s history, which is saying something. At the other end of the spectrum, Kansas City can clinch the AL West tonight with a win and a Twins loss. I remember when we used to joke that at least the M’s org wasn’t as bad as the Royals or Pirates. Both of those teams are *returning* to the playoffs this year.
Johnny Cueto’s been a rather disappointing pick-up since the Royals traded for him in late July. In 10 starts, he’s gone 2-6 with an ERA over 5 thanks to a very high BABIP. By FIP, he’s been merely average, which still isn’t quite what Dayton Moore thought he was buying, but it’s reason for hope (of a sort). Cueto’s explanation of what’s gone wrong is, at least in part, that catcher Sal Perez kept his glove too high, and this caused him to elevate pitches. After talking with him about it, he pitched quite well, though as Jeff Sullivan noted, he threw the ball *higher* than he did before. It’s not important if Cueto’s explanation was true or not – if Cueto believed it was affecting him, then he was right to say something. Pitching coach Dave Eiland blamed a mechanical issue with Cueto’s delivery – that his front shoulder was flying open. Both explanations are somewhat hard to evaluate, given that no pitcher always hits a catcher’s target and that Cueto’s twisting delivery means his front shoulder goes flying on every pitch. Whatever the real explanation (and it may just be BABIP luck and stranding runners), I can’t imagine Cueto’s the favorite guy in the clubhouse after pointing the finger at Perez.
Cueto throws a four-seam fastball at around 93 and has a great diving change-up that racks up whiffs and strikeouts. This year, he’s missing just as many bats, but batters have really made him pay for mistakes. When he leaves it up, batters have done very well. When he gets it down – which is typically where he wants it – the results have been much better. Given his career-best walk rate, it’s hard to detect command issues, but the results make you wonder – in 10 games, he’s given up 9 HRs, including 7 in two games against Baltimore. Most of the damage has been done by right-handed hitters. The change is still quite effective against lefties, but he’s using it pretty often against righties, and it hasn’t been as successful. There’s nothing really wrong with that approach – it moves somewhat like a splitter, so it shouldn’t have much in the way of platoon splits. The cutter he developed recently has also been a bit spotty. Cueto’s dead-even platoon splits last year have turned into extreme *reverse* splits this year, as his K% is much higher against lefties, while he’s giving up more HRs to righties. His FIP to lefties is 2.83, but to righties it’s 4.13.
Cueto’s not *really* a guy with extreme reverse platoon splits; he’s a guy who’s made a number of bad pitches to righties, and paid a steep price. But it’s also worth considering that he isn’t a true-talent 80% left-on-base guy either. In 2013 and 2014, he put up great ERAs despite solid-but-not-Cy-Young-worthy FIPs thanks to ridiculous BABIPs of .236 and .238. Even with his so-so few months in KC, Cueto’s FIP is right in between in 2013 and 2014 marks; he doesn’t look like a different pitcher at all, it’s just that now his BABIP is a low but not insane .275, his strand rate’s lower and his ERA matches up with his FIP. Still, Cueto had full season BABIPs under .250 three times from 2011-2014, which is kind of incredible for a righty. He’s clearly pitching in front of a better defense now than when he was in Cincinnati, but it may be that Cincinnati knew a lot more about how to position themselves behind him. If that’s true, and I haven’t done any looking for evidence that it is, I wonder if that’s part of what’s going on in the so-called free agent penalty – the observation that players who stay with a team tend to do better than veteran players who sign with a new club.
1: Marte, SS
2: Seager, 3B
3: Cruz, DH
4: Cano, 2B
5: Smith, LF
6: Trumbo, RF
7: Morrison, 1B
8: Miller, CF
9: Sucre, C
SP: Paxton
Game 152, Mariners at Royals
Roenis Elias vs. Yordano Ventura, 5:10pm
Not sure if Jeremy Guthrie’s going to make the Royals playoff roster. Yesterday’s disaster start did serious damage to his FIP, and pushed his fWAR (which is based on FIP) down from -0.5 to -0.9. By runs allowed, the picture is somehow even worse: -1.0 WAR thanks to an RA that’s now over 6.
I didn’t come here to bury Mr. Guthrie, however. Rather, I wanted to note that the Royals have surged to the top of the AL despite a second consecutive down year from their all-star catcher, Salvador Perez. In a development pattern that’s bizarre to everyone except M’s fans, Perez has put up the following wRC+ figures since his debut in 2011: 126, 114, 106, 92, 86. Perez’s bat-to-ball skills are freakishly good, and even now he strikes out much less than most hitters, but his return on all of the balls in play he produces have grown steadily worse, and while his walk rate was never good, it’s now a real red flag. 43 catchers have had at least 200 plate appearances this year. By OBP, Perez’s .276 mark ranks 39th. In case you were wondering, Rene Rivera spared Mike Zunino the ignominy of having the lowest OBP by putting up a remarkable .180/.214/.279 line that looks like it’s from the dead ball era. Perez started from a much better place than Zunino, but the trajectory looks familiar. I wondered if other catchers fit this profile, but they’re pretty hard to find. Like most players, catcher offense benefits from experience and normal aging curves. As Perez *has* reached the 20 HR mark for the first time, I wondered if he was selling out for power, but there’s not a lot of evidence for that in his pull percentage or GB/FB ratio. I bring it up not because it’s crippled the Royals – they’re pretty obviously doing fine – but because I’m fascinated, and oddly encouraged, when I see other teams have development…oddities like the M’s.
Today’s starter, Yordano Ventura, has had an eventful year. From odd cramping problems, to a suspension for plunking Brett Lawrie to a mid-year demotion to AAA, you’d think Ventura would be having a year to forget. It hasn’t been *good*, but Ventura’s starting to turn his elite stuff – the fastest starting pitcher fastball, for example – into strikeouts. When he came up, he put up great results without strikeouts thanks to oddly low BABIPs and good ground ball rates. This year, his GB% is even higher, and he’s finally above the league average in K%. His curve has developed into a great pitch, and while he has some platoon splits, they’re minuscule thanks to a good-if-erratic change-up. That said, his nearly-100mph fastball’s been oddly hittable. This year, batters are hitting .367 and slugging .600 on Ventura’s four-seam fastball – he’s got a sinker as well, but the four-seamer’s the one he uses most often. Last year, the league hit .235 off of it. Obviously, sample’s an issue here, and his true talent is probably in between these two marks, but the point is: Ventura’s fastball’s sucked, and Ventura’s paying a price for it.
Back in June, Jeff Sullivan noted that Ventura led the league in pull% – the percentage of balls in play allowed that were pulled. This was true of fly balls as well as grounders, and generally made a mockery of the small but consistent inverse correlation between velocity and pull%. For some reason, batters find it really easy to turn around Ventura’s fastball. Checking in now, Jered Weaver’s got him beat, but Ventura’s still #2. Fangraphs’ numbers don’t break out grounders (which tend to be pulled more often) from other balls in play, so it’s not a big surprise that much of the top of the list is made up of ground ball guys like Felix, Jeff Locke and Charlie Morton. So: batters pull the ball against Ventura, and batters have destroyed Ventura’s fastball. So are they pulling his fastball? Strangely, not really. Here’s a balls-in-play heatmap of *left* handers against Ventura’s fastball:
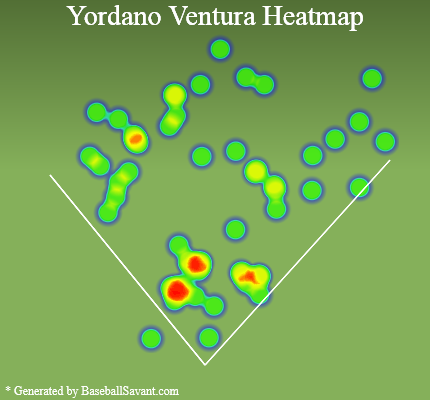
The righty version looks much the same. What I think may be happening is that hitters have to start so early on his fastball, that they invariably pull pitches that come in slower, like his change-up. Ventura’s change averages 88mph, so it must be tempting to either get more sink on it (so batters swing over the top) or slower speed (so they get their bat out of the zone before the pitch arrives), but I can imagine both of those things are easier said than done.
What Ventura *has* done is tweak his delivery a bit. He’s much more 3/4 as opposed to more over the top, and thus his vertical release point’s come down. That’s taken some of the “rise” off of the four-seamer while adding a bit of horizontal run. No idea if that change has made it easier to see, but it has coincided with much lower fastball whiff rates and *higher* breaking ball/offspeed whiff rates. Add it all up, and Ventura’s got a solid FIP but a mediocre ERA and RA thanks to a high BABIP – and Ventura certainly can’t blame that on poor fielders. Ventura’s always been a polarizing prospect/player, and I can imagine few players would generate a wider spectrum of answers as to how to value him.
1: Marte, SS
2: Seager, 3B
3: Cruz, DH
4: Cano, 2B
5: Gutierrez, LF
6: Smith, RF
7: Trumbo, 1B
8: Miller, CF
9: Sucre, C
SP: Elias
Game 151, Mariners at Royals
Hisashi Iwakuma vs. Jeremy Guthrie, 5:10pm
I wrote about the huge gap in W/L records between the M’s and Rangers despite some striking similarities in their peripheral stats the other day, but I could’ve written much the same about the M’s and Royals. With the AL clustered around .500, perhaps it’s to be expected that a team could get to 10 games over .500 or so through a combination of sequencing and whatever’s in the black box that we can’t yet measure. But the Royals have laid waste to the league, owning the league’s best record since early June or so. While they haven’t been perfect in recent weeks, they’re still a game up on Toronto, a team that seemingly hasn’t lost since the trade deadline.
And yet, the Royals and Mariners are tied with identical wRC+ marks for their offenses. The Royals have a better OBP, the M’s have a larger lead in slugging. Their pitching staffs rank 18th and 19th by FIP. Park adjusting that gives the Royals a clear but small lead in fWAR, but by xFIP the M’s have a similar edge. By park adjusted ERA, the Royals have a clear advantage, and that starts to hint at a few of the reasons why the Royals have outplayed their raw FIP.
First, and perhaps most importantly, they remain one of the best fielding clubs in baseball. By most measures Fangraphs has (like UZR), the Royals lead all teams in runs saved. By DRS, they’re second, but it’s quite close. As we heard about last year, their outfield is a real strength, and they’re still excellent, though they rank second behind Kevin Kiermaier and it-literally-doesn’t-matter-who-else of the Rays. They’re solid at nearly every spot on the IF as well, and this run-prevention group is a big reason why the Royals staff has given up far fewer runs than you’d expect if you just glanced at FIP. Add their batting runs to their fielding, and the Royals position players have a ten-win edge on the M’s’ group.
Second, they strand runners thanks to an elite bullpen. The pen’s been a strength of the club for years, but the group STILL has the lowest bullpen ERA in the AL, a solid-but-not-incredible FIP and they’ve done it all throwing more innings than any other AL team besides Tampa. The bullpen gives the Royals a clear advantage in close and low-scoring games, and they’ve come from behind to win 37 games while only coughing up a lead 24 times. This also doesn’t feel “lucky” per se, especially given that they’ve been dominating at the tail end of games for 3-4 years now. Interestingly, their closer, Greg Holland, has been struggling of late and today the Royals announced he’d be moving out of the role due to a mild elbow injury. Not only that, but even when he’s back, the guy with 125 saves since the start of 2013 won’t get his old job back: the Royals are sticking with Wade Davis, the lefty acquired as the 2nd part of the huge Wil Myers/James Shields trade (which now that neither of those guys play for the teams that acquired them, maybe we should just call the Wade Davis for Jake Odorizzi deal). It’s Davis who’s been the real star of the KC bullpen this year – he’s 3rd on the team in fWAR, but that probably undersells him. Since the start of 2014, a period covering over 130 innings, Davis has an ERA under 1 and has given up all of 2 home runs. His FIP last season was 1.19, but has soared to 2.22 this campaign. The Royals are gonna be fine at closer, is what I’m saying.
At the other end of the Royals WAR list stands tonight’s starter, Jeremy Guthrie. Guthrie’s not a strikeout pitcher, so he’s benefited greatly from the all-world defense behind him, and as a fly-ball pitcher, he’s been especially fortunate (he and Chris Young are tailor-made for this club). It’s one reason why Guthrie’s so consistently “beaten” his FIP. From 2007 to 2014 – *8* full seasons – Guthrie posted a lower ERA than FIP, and some years, 2013 for example, the gap was huge. That streak looks like it’s coming to an end this year, and Guthrie’s currently sporting an ugly ERA (and FIP) solidly above 5. If the Royals weren’t leading the AL, this would probably be extremely frustrating to Guthrie, considering how little difference you see in his stats: his velocity’s essentially the same, his K% is exactly where it was in 2013, and his BB% is higher only fractionally. BABIP and strand rate have worsened, as they’d have to, but hitters are making *less* contact than they did in 2013. They *are* hitting the ball in the air a lot more, as his line drive rate has spiked and his fly ball rate is higher than it’s been since he was a Baltimore Oriole. And thus, despite a fairly normal HR/FB, he’s given up an awful lot of HRs. Lefties have always given him trouble, but in recent years, his platoon splits have gotten fairly extreme.
1: Marte, SS
2: Seager, 3B
3: Cruz, DH
4: Cano, 2B
5: Gutierrez, LF
6: Smith, RF
7: Montero, 1B
8: Miller, CF
9: Sucre, C
SP: Iwakuma
Given Guthrie’s splits, you’d expect to see LoMo in there at 1B, but there are two reasons why he’s not. First, his wife gave birth to a baby girl last night, so LoMo’s taking some paternity leave (congratulations, Morrison family). Second, Montero’s got great stats against Guthrie in what is obviously a small sample. We can talk about the validity of stats like that, but they clearly matter to McClendon, and may mean more to players than we’d think.
Nelson Cruz quad continues to bother him, though it’s obviously not keeping him out of the line-up. Today, Lloyd said we wouldn’t see Cruz in the field again this year.
The Brewers filled their GM vacancy with 30-year old Houston AGM David Stearns. The M’s have been oddly silent, especially given how much Mather stressed he wanted someone soon. There was talk that Jerry Dipoto interviewed back in early September, and more recently, we’ve heard the M’s have interviewed Yankees AGM Billy Eppler. If the M’s are open to folks who haven’t been GMs before (they said they weren’t, of course, but Eppler’s never been a GM), they may want to speak to Quinton McCracken, the head of player development in Houston. McCracken’s led a PD group that’s been jaw-droppingly successful this year, though how to apportion credit for minor league success and success in MLB is always tough to do. The M’s may not have a chance, as McCracken’s already interviewing for the Boston job.
The Mariners, The Rangers and the L Word
The M’s finished off their series in Arlington today against the first-place Rangers. The fact that the Rangers are in first is one of those things I find fascinating given their pre-season projections, their injury issues and the months and months that saw Shin-Soo Choo and/or Elvis Andrus hitting like replacement level players. The more you look at the Rangers’ campaign, the more fascinating it gets.* There’s been a lot of talk this year about variance – about a team’s base runs not correlating all that well with their actual W/L record (or run differential), about a team’s performance with runners in scoring position or close games, or any number of reasons that traditional pythagorean records have failed in their assessment of a club. To fans of said clubs, this is either evidence that advanced metrics have, in the charitable version, holes and blind spots, or, in the less-charitable (and less-credible) version, biases against this or that specific team. Because the Mariners are where they are in the standings, and because they seem to be there rather frequently, I thought it’d be a good idea to take a closer look at how and where the Rangers have excelled – to take a forensic look at *which* advanced metrics lead us furthest from their actual record, and how the M’s look in comparison. The point here isn’t to make the Rangers look bad – this is an attempt to figure out what’s going on. I’ll admit I’ve tended to watch the Rangers when they face the M’s, and that view hasn’t done a lot to illuminate the Rangers’ strengths. I’ve watched a limited set of games, so I’ll turn to some less-limited numbers.
The first thing we have to acknowledge is that there are far, far more ways to be “clutch” than are commonly identified. A few years ago, the Orioles won far more games than their overall WAR would’ve implied, and the reason was largely due to a great bullpen performance that produced an insane record in 1-run and extra-inning ball games. At the time, sabermetric fans scoffed, but O’s fans thought that the combination of a great tactical manager in Buck Showalter paired with a preternaturally dependable closer (Jim Johnson, who is just as remarkable in more recent years, but for much worse reasons) meant that this variance from their pure pythagorean record (the O’s won 11 games more than their pythag) wasn’t so much luck as a specific kind of skill. The next year, the St. Louis Cardinals actually *under*performed their pythag, but their incredible run differential seemed out of proportion to their overall batting line. By position player WAR, they were so-so, and though they were above-average in park-adjusted batting, they lagged clubs like the Angels and A’s. Despite all of that, they outscored the Angels and A’s by 50 and 20 runs…despite the fact that AL clubs get to use DHs. The Cards scored 77 more runs than 2nd place in the NL (the Rockies) because their were out of their minds with runners in scoring position – they put up an unreal .330/.402/.463 line that lapped the field. We haven’t seen anything like it in recent years, and the fact that it was “unsustainable” won’t take away the NL Pennant the cards won that year.**
When we talk about teams “beating” their lines or run differentials, these are the teams that leap to mind – not only are they recent, but they follow some established, identifiable pathways to improbable win totals. But this year’s Rangers simply don’t look like this. They’re 11 games over .500, but their pythagorean record is 74-74. Thanks to a sub-par pitching staff, the Rangers have given up exactly as many runs as they’ve scored, and before this series began, they were 7 runs in the red. So, is this a Baltimore thing where they’ve won close games and had tons of comebacks? Short answer: no. The Rangers do not have an amazing record in 1-run games, and they don’t have tons of comeback wins. On those measures, they look remarkably like the M’s. It’s not Cardinals-style performance with runners in scoring position either. The M’s have been awful, but when you park adjust, the Rangers have actually fared worse. If you prefer RE24, which just tallies the change in run expectancy for each event, both teams are solid, but the M’s pitching staff fares (predictably) worse.
| Team | OPS w/RISP | RISP wRC+ | One-run wins | Comeback wins | Bat. RE24 | Pitch RE24 |
|---|---|---|---|---|---|---|
| Mariners | 0.685 | 81 | 27-24 | 29 | 31 | -97 |
| Rangers | 0.694 | 87 | 26-20 | 27 | 41 | -42 |
From the data in the table above, I think you’d expect the Rangers to lead the M’s, but you’d probably expect both teams to be below .500. Looking at the *contextual* stats, neither the M’s look particularly good. That can happen to good teams, and it’s been a big reason why the A’s have struggled despite a GOOD run differential. So let’s take a look at some overall numbers as well:
| Team | Runs Scored | Runs Allowed | wRC+ | Pos. Player WAR | Pitcher ERA- | Pitcher FIP- | Pitcher fWAR | Pitcher rWAR |
|---|---|---|---|---|---|---|---|---|
| Mariners | 597 | 667 | 101 | 14.7 | 107 | 105 | 9 | 9.6 |
| Rangers | 666 | 666 | 95 | 17.1 | 100 | 105 | 10 | 13.7 |
The thing that jumps off the page to me is how similar the M’s look. Neither team looks particularly good, mind you, and at least the Rangers have an ~70 runs-scored advantage, but these teams look like they’d be closer than the 8.5 game advantage the Rangers actually have. This isn’t to take anything away from the Rangers or to insinuate the M’s have been horrifically unlucky. What it DOES say is that we’ve looked at a lot of numbers and *still* can’t quite identify why the Rangers are 12 games over .500. By ERA they’re not so great; they look better when you park adjust (which ERA- does), but if you do that, you have to park adjust their overall batting line, and that makes them look somewhat feeble.
Like a lot of people, including former co-blogger Dave Cameron, have been talking about this a lot, and the conclusion that he’s come to, and the conclusion that Rangers fans really, really hate hearing, is that it’s purely luck. What the data imply is that the Rangers’ ‘skill,’ if you will, is that they score runs in games when they need them, and then don’t score (or do much of anything) in losses. When you put it like that, it sounds crazy, and even looking at their batting and pitching lines in wins and losses, there’s no evidence that they perform any different than other teams. By the numbers, there’s no obvious way around the conclusion that their peripheral numbers don’t support their actual win/loss record. But that’s not interesting. So let’s do this instead: if there WERE some non-luck reason(s) the somewhat similar-looking M’s and Rangers should be 12 games over and 6 games under .500, respectively, what would it(they) be?
1: The park adjustment is missing something.
This is a flavor of measurement error; that, somewhere in the process of neutralizing and contextualizing all of these stats, Fangraphs and Bbref screwed something up. In this case, there’s a big difference in the raw stats and the park-adjusted ones. Maybe the park factors have missed something important – they may still be relying on pre-dimension-changed Safeco numbers, for example, or Texas’ may be inflated by a couple of scaldingly hot years in the recent past. Thanks largely to Nelson Cruz, the Mariners actually have a higher ISO than the Rangers – are the M’s getting more credit for that than it’s worth? Always possible, but this seems extremely unlikely. Or rather, if it affected their batting line, you’d figure it’d affect each team’s pitching WAR as well.
2: A low run-scoring environment has put a premium on things like base-running and the bullpen.
The Rangers are a good base-running team; they’ve earned nearly 12 runs above average in base-running according to Fangraphs, good for first in the AL and 3rd in baseball. The M’s, meanwhile, have the worst mark in MLB, at nearly 22 runs below average. That’s a big gap – it’s essentially as big a gap as you can get, and it just doesn’t seem like it’s anywhere close to big enough. Could there be some sort of reinforcing effect at play? A pitcher’s park PLUS bad base-running makes it exponentially more difficult to score runs, or something? Maybe, but it seems like that would show up either in the park factors themselves or in the base-running value measures.
As far as the low run-scoring environment goes, I wondered if it wasn’t a particular problem for the M’s. Recent research by David Smith concludes that a shockingly high chunk of what we call home field advantage stems from the fact that home teams outscore their opponents by a lot in the first inning. The theory is that pitching first is something of an advantage, because even if you give up some runs, the opposing starter has been sitting on the bench for a long time – essentially, the home starter goes right from warm-ups to the mound, while the visitor doesn’t exactly know when he’ll be called upon to pitch. This shows up in high run-scoring enviroments as well as low, and it persists even if the home team has just traveled. So: if the M’s were really bad at scoring overall, might they not enjoy this benefit? Is that what’s causing this gap between batting RE24 and runs? Er, no. The M’s haven’t scored a ton of runs in the first inning at Safeco, but they’ve given up even fewer. Their differential looks exactly like it should, only the numbers are lower – which is what we’d expect.
So, the bullpen. Both of these clubs have poor overall marks for bullpen performance. The Rangers’ ERA and FIP are slightly higher, but they have a small lead in WAR (1.6 to 1.3) thanks to park adjustments. Neither team is above average in any of these stats, and both are in the bottom half by strand rate, too. The distribution of pitcher WAR is different, with the M’s having both the most valuable reliever (Carson Smith) as well as the *least* valuable relievers (Joe Beimel, Fernando Rodney). The M’s have given more innings to guys having awful years, but it’s not a huge gap. Still, this is an area where depth could come into play. The M’s haven’t found a good replacement for either Mark Lowe or Charlie Furbush – Beimel was supposed to stand in for the latter, and that really didn’t work out.
3: Depth and batting order black holes.
For years, the M’s have under-scored their base runs, and for years, the M’s have struggled with offensive sinkholes towards the back of their batting order. Mariner catchers this year are hitting an unfathomable .157/.208/.260, good for a wRC+ of 29. Remember 2013, when the M’s had to rush Mike Zunino to the majors because no one could hit? They posted a wRC+ of 63 that year. This is historically awful, but could it account for the gap between RE24 and runs? Maybe, but the Rangers have struggled with some black holes (though not quite as black) too. Their CFs rank 29th in baseball in wRC+ thanks to the implosion of Leonys Martin. In fact, their OF as a whole ranks 29th, as Jake Smolinski, Ryan Rua and Ryan Strausborger have all scuffled. The Rangers have just one OF with more than 2 WAR (Choo), while the M’s have 4.
But what’s helped the Rangers is that they’ve been better about swapping out ineffective players with good ones. They didn’t go from Zunino to Jesus Sucre, they went from Carlos Corporan to Robinson Chirinos. Jake Smolinski (and Joey Gallo and Ryan Rua etc.) weren’t cutting it, so the Rangers traded for Will Venable, and they sat Martin in favor of Delino DeShields. This hasn’t always worked (Venable and Josh Hamilton haven’t done much, and Drew Stubbs has been awful), but it’s worked enough. This contrasts with the M’s, who still haven’t found a real starting catcher, and whose bullpen has gotten noticeably worse in the second half, not better.
The bullpen is perhaps a better example of this, as the Rangers have figured out who to turn to in high leverage situations. Lefty Sam Dyson and righty Jake Diekman have *only* pitched in the 2nd half, while Tanner Scheppers and Ross Detwiler haven’t been able to do more damage. That’s probably helped, but it’s worth remembering that even in the 2nd half, when the team is a combined 16 games over, they still don’t have a great run differential. Thanks to their recent sweep of Houston, it’s finally in positive territory, but it’s not great. Still, one could argue that the M’s – as a team in a low-scoring park – have been especially hurt by their bullpen’s second-half struggles. That would imply that the Rangers, with THEIR home park, haven’t needed their pen as much, which makes it harder to argue bullpen depth and sorting out the good from the bad *isn’t* the cause of their surge.
4: Good players underperforming and then bouncing back.
Many Rangers fans argue that their seasonal stats look bad due to the first half, when Adrian Beltre and Shin-Soo Choo were both hurt and bad. Prince Fielder carried them, but could only do so much. That’s similar to the predicament the M’s were in, where Nelson Cruz was dominant, but had no one to drive in thanks to Robinson Cano and Kyle Seager’s struggles. In the 2nd half, Choo’s been the best hitter in the AL West with Beltre not far behind, but Fielder’s regressed significantly. Meanwhile, the M’s got solid production from Cano and Seager, but Cruz hasn’t really dropped off. At least on the batting side, the M’s have benefited from (positive) regression and their offense has been one of the league’s best, particularly once they started getting production out of the lead-off spot – it may seem hard to remember, but the M’s OBP from their 1st hitters has impacted by several starts from Rickie Weeks and Logan Morrison.
Yet despite the fact that the M’s have a higher wRC+ in the 2nd half, the Rangers have scored more runs. The same (or different?) effects that led the Rangers to yield more runs from each batting event has held true in the second half, despite the massive swings in the performance of several of their star players. Baseball!
5: Run scoring, and how runs translate to wins, is messy at the team level.
I’d love an actual explanation, and for those who think this answer is essentially hand-waving, you’re pretty much right. But if you’ve got other theories, I’d love to hear them. The Rangers have scored a higher percentage of their total runs in wins (73%) than the M’s (65%), but it’s hard to attribute that to skill. You can argue that the Rangers have simply been better at beating the teams they *should* beat, but the M’s and Rangers are both 4 games over .500 against teams with sub-.500 records.
Because the M’s record is so driven by their poor performance at home, and because this isn’t the first time the M’s have struggled at home, I kept thinking that Safeco was part of the reason why the M’s look so different from the Rangers. But look at the M’s run differential on the road: they’ve been outscored by 47 runs on the road…and yet they’re 38-36. The weird devil-magic that we ascribe to the Rangers seems to be the same stuff that’s allowed the M’s to post a .500 record despite a pythagorean record far, far worse than their home mark.
Apparently, this kind of thing happens every now and again, and because it does, it seems harder to credit the Rangers with some innate advantage in runs-per-win. That doesn’t mean this post is dispositive, and if you’ve got alternative theories as to what the Rangers have done, I’d honestly love to hear them. I’d hope teams have a better idea about why this happens, though I’m sure they’re also able to quantify just how much luck/sequencing goes in to a team’s record.
While luck and randomness seem to play a big role, I do wonder about park effects. In isolation, the effect may not be large enough to matter, but I wonder how large the effect can get once you layer on crappy base-running, a sub-par bullpen and the like. Again, this seems like the kind of thing that would be dwarfed by the overall talent of the club, but the point of this post was to call attention to just how close the M’s and Rangers seem to be at everything but the whole “wins and losses” thing. Yet another thing I’d ask a GM candidate who wanted to take the reigns.
The Rangers have outplayed the M’s, at least when the Rangers don’t actually PLAY the M’s. The gap doesn’t appear to be large or the result of clear and consistent advantages in true talent. That’s encouraging for M’s fans, of course – this could be us someday. On the other hand, the Rangers are doing this without Yu Darvish, Jurickson Profar, Matt Harrison, etc., and their surge is correlated with 2B Rougned Odor’s hot-streak. Both clubs are getting production from young players, and both teams are dealing with adversity. The Rangers have been fortunate in some ways this year, but that doesn’t mean the M’s will be favored next season.
* Your mileage may vary. Maybe I’m easily fascinated.
** This year, of course, the Cards are doing something similar, but on the pitching side. With men in scoring position, Cards pitchers have given up a .263 wOBA, a mark that’s above all of 2 qualified batting lines. With RISP, the Cards turn the entire NL into Alcides Escobar-with-flu-like-symptoms.
Game 150, Mariners at Rangers
King Felix vs. Derek Holland, 12:05
Happy Felix day, M’s fans.
Despite the Rangers’ easy win yesterday, they couldn’t pull another game ahead of the Astros, as Houston broke their long losing streak against the A’s (and struggling ace Sonny Gray). Back on the 10th, the M’s beat Holland and Texas behind a classic Felix performance in a game that felt like it would mean more than it did. Instead, the Rangers re-grouped and swept Houston in 4 to take charge of the division.
Holland’s return has to be encouraging for a Rangers club that’s had to deal with a patched-together rotation all season. Encouragingly, his velocity is all the way back to pre-injury levels (that is, back to his 2010-2012 averages). His slider is still a very effective pitch against righties and lefties alike, and it’s Holland’s best swing-and-miss pitch. He’s got a change, but it’s never really been all that good either at inducing grounders or whiffs. Theoretically, it should help make his fastballs better by giving the hitter something else to keep in mind, but it’s not a great pitch on its own.
This year, whatever benefit the cambio provides his fastballs is pretty tough to identify. Since his return, his four-seam and sinker have been remarkably, impressively whiff-resistant. Holland has thrown 154 sinkers at an average of 94mph, and with nearly 11″ of armside run, and he has all of two whiffs. Two. One came in his abbreviated 1-inning, injury-plagued start against Houston back in April, so since his retun, he’s thrown about 150 sinkers and racked up a single swing and miss. It came in Seattle, because of course it did. Swings and misses on fastballs has never really been Holland’s strength, but not having ANY reduces his margin of error. You might think the small sample distorts this; maybe he’s faced a lot of contact-oriented teams. In actuality, he’s faced Houston, Baltimore, Seattle (and Toronto and Anaheim) – if anything, he’s faced a slate of hitters that swing and miss much MORE than average. Holland hasn’t paid a big price for this, thanks in part to his slider’s continued effectiveness and in part to a career-low walk rate.
Felix is 4-0 against Texas this year, with two starts early in the year against the odd, punch-less Rangers and two starts since August, when the Rangers have been on fire. Felix cares nothing for your run differential, your 2nd half record, your team depth or your deadline pick-ups.
1: Marte, SS
2: Seager, 3B
3: Cruz, DH
4: Cano, 2B
5: Gutierrez, LF
6: Trumbo, 1B
7: Smith, RF
8: Romero, CF ?
9: Sucre, C
SP: THE KING
Soooo, Romero will make his first ever start in CF as a professional. I don’t see any CF starts in college either – the Beavers has Adalberto Santos in CF when Romero played there, and Santos was good enough to make it to AAA. This game isn’t crucial to the M’s, so you can see the argument that they should figure out what guys are capable of going forward. But the M’s have expanded rosters, and their best option is sending a guy out to a position he’s never played before? Before Miller made the move to CF (or Dustin Ackley, or Ketel Marte), the M’s talk about how well the players have responded to coaching from guys like Andy Van Slyke or other positional coaches. There’s essentially none of that here – it’s just a shoulder shrug and a, “hey, how hard can it be?” Good luck, Stefen. Keep the ball down, Felix.
David Laurila has a great interview with Edgar Martinez at fangraphs which is well worth your time. Edgar talks a lot about being quick to the ball by eliminating a lot of pre-swing hand movement. It’s the kind of thing I’d love to see him work with, say, Jabari Blash on. Blash had a great year, but his hands are so high and his arms are so long that he’s going to be vulnerable to inside fastballs. Blash’s natural power and some path-shortening thanks to Edgar would be a nice combination. Ah well.
As nice as it’s been to see the M’s hitting take off after Edgar arrived, there’s a confounding variable: EVERYONE’S hitting took off recently. MLB teams scored more runs per game in August of this year than in ANY month in the past 5 years. That’s one of many interesting facts Jon Roegele discovered in this Hardball Times article. In the first half of the year, MLB put up a combined .309 wOBA. Thanks to the August run-scoring explosion, they’re at .320 in the second half. The league last had an overall wOBA of .320 in 2010, the beginning of the recent offensive ice-age.
Game 149, Mariners at Rangers
Vidal Nuno vs. Cole Hamels, 5:05pm
Yesterday’s M’s win snapped the Rangers 5 game winning streak, but it didn’t do too much damage to the Rangers’ division and playoff odds. Thanks to the Astros’ on-going collapse, the Rangers maintained their 2.5 game lead. The Astros’ allowed an 8th-inning go-ahead HR to Danny Valencia of the A’s and lost 4-3 in a game they once had a 3 run lead. That’s five in a row for Houston, and they’ve now won just 2 of their last 11.
It’s probably not a huge surprise that Cole Hamels’ HR rate has crept up since being traded to Texas, but his BABIP’s been high over his first month and a half in the AL, too. That’s something of a rarity for Hamels, who has a lifetime BABIP of .286. With the Rangers, it’s at .313; the last time Hamels had a BABIP that high was 2009. Hamels hasn’t been bad – he’s been worth about 1 fWAR over 8 starts – but his RA/9 WAR isn’t great. The Rangers have made a lot of savvy moves in this playoff race, but it’s kind of funny how few of them have worked out (Will Venable is slugging .236 for Texas). It’s also funny how little it’s mattered.
1: Marte, SS
2: Seager, 3B
3: Cruz, DH
4: Cano, 2B
5: Gutierrez, LF
6: Trumbo, RF
7: Montero, 1B
8: O’Malley, CF
9: Hicks, C
SP: Nuno
Game 148, Mariners at Rangers
James Paxton vs. Yovani Gallardo, 5:05pm
Sooooo, the Rangers, huh? The Rangers are fresh off a dominating, potentially season-defining sweep of the erstwhile 1st place Astros. Now 2.5 games up, the Rangers playoff odds have shot up by 44 percentage points. In a week. When Felix was polishing off the Rangers and Derek Holland, I noted that the loss – and the resulting split of the four-game series – had done some serious damage to the Rangers’ playoff hopes. As it turns out, the Rangers had a solution for that.
This’ll be Gallardo’s fourth start of the year against Seattle – he shut them out through 5+ last week, his second scoreless start against the M’s this year. The righty continues to be an important stabilizing force in the Rangers’ banged up rotation. I’ve got a big post coming later on the Rangers blowing apart not only their pre-season projections, but also their in-season peripheral stats, but I’ll just say that, Gallardo aside, pitching has not been a real strength of the club. That said, they’ve performed much better in recent games. Part of that is figuring out which of their young arms to trust out of the pen (Sam Dyson/Keone Kela), and part of that is the byproduct of utterly dominating the Astros in four games, including knocking Dallas Keuchel around.
James Paxton needs to stay healthy and find the strike zone. As great as his pure stuff still looks, there are some worrying trends that show up – and that’s setting aside the huge gaps in his performance record for time spent on rehab. Paxton’s never been a guy who gets hitters to chase pitches out of the zone, but it didn’t matter when batters struggled to make contact on strikes. Each year, Paxton’s slipped in that measure, and to make matters worse, he’s slipped in the percentage of pitches in the zone too. If people aren’t going to swing at balls, and you throw more balls, you’ll have to deal with some walks. That all sounds grim, but one thing Paxton still seems to do well is limit contact. He’s running a very low BABIP again, just as he always has. Given the sample, it’s tough to know what to make of that, *particularly* because he’s not the guy who gets a ton of contact on balls out of the zone (which tend to be turned into outs very frequently). Pure velocity may help with that, and a great curve probably does too (as does being left-handed), but I’d be more comfortable if he could balance that out with a plus K%. There’s no reason for someone of Paxton’s talents to be at 18%.
1: Marte, SS
2: Seager, 3B
3: Cruz, DH
4: Cano, 2B
5: Trumbo, RF
6: Smith, LF
7: Morrison, 1B
8: Miller, CF
9: Baron, C
SP: Paxton
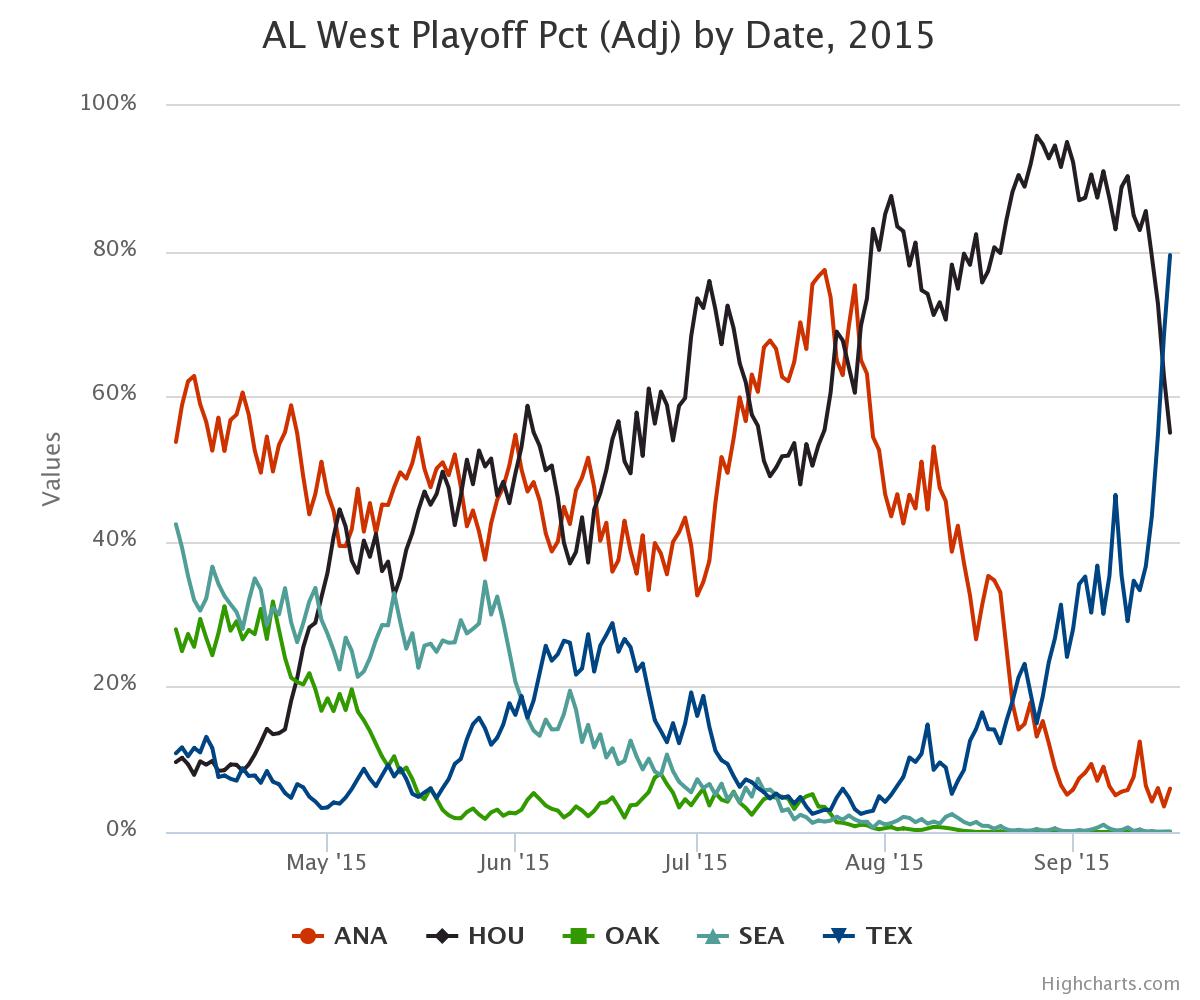
Just for fun, here’s BP’s playoff odds graph for the AL West. This week has been…uh…important.