
2008 Win Values
“We have to analyze the talent we see and assign the proper value to it.” – Neil Huntington, Pittsburgh GM, in an article published yesterday.
The Pirates are the newest team to hire a GM with a strong belief in quantifying value. Not surprisingly, Huntington came out of Cleveland, an organization that has been using their intellectual advantage to win games for years. One of the basic fundamentals of the methods adopted by teams like Boston, Oakland, Cleveland, San Diego, and Arizona is the belief that all players have a quantifiable on field effect that can be summed in a win metric that allows for proper valuation. Evaluating talent is huge, but so is properly valuing performance – they go hand in hand, and doing one without the other is a wasted opportunity.
So, that’s what this post is about – valuing talent in terms of wins. I’ve taken the best approach to win analysis available and applied it to the Mariner roster, taking a projected performance for the upcoming year and converting that into a win value that factors in both run production and run prevention, with necessary adjustments for the position being played, the role the player will be used in, and the environment they call their home field. In the end, this allows us to size up the entire roster in terms of what we expect their on field contribution to be this season, how much that contribution is worth, and how much value they are adding to the franchise in 2008.
The starting spot for analysis of position players is offensive production. Every outcome of every plate appearance has an average run value that we can assign to that event, allowing us to convert an overall projected batting line into a run production number. This concept is known as linear weights, and is accepted as the best method for quantifying offensive value. If you want to read more about linear weights, here’s a three part series that covers the concept and shows how it works. There are a few different linear weight run estimators out there; I chose to use Weighted On Base Average (wOBA for short) because the math is the easiest to follow in getting from runs to wins.
Despite using On Base in the term, it’s a valuation of total hitting production. It gets its name from the fact that its scaled to look like on base percentage, so if you’re familiar with what a good/bad/average OBP is, you also know what a good/bad/average wOBA is. .300 is lousy, .340 is average, .400 is awesome. wOBA is presented in detail in The Book, written by Tom Tango, Andy Dolphin, and Mitchel Lichtman.
The formula for wOBA is wOBA = (0.72 BB + 0.75 HBP + 0.90 1B + 0.92 RBOE + 1.24 2B + 1.56 3B + 1.95 HR) / PA. Pretty simple – the multiplication is performed according to run values of each event scaled to look like OBP (in this case, the ratio of one to another is more important than the actual multiplications). Singles are worth a bit more than walks, but less than doubles, which are worth less than triples, and nothing is worth more than a home run. Nothing scary here. The only thing wOBA doesn’t account for is baserunning, so I’ve made manual adjustments for the necessary players who extract value from their legs.
So, all you have to do is have the data for those categories, and wham, you have wOBA. Once you have that, you can simply compare a player’s wOBA to the league average wOBA (AL average is .338, but I used .334 to account for Safeco) to get his offensive production above or below average. Note – this is not position adjusted – we’re just comparing hitters to hitters right now. Once you have the difference, you can divide that by 1.15 (wOBA’s relation to runs), multiply by a full season plate appearance estimate for each role (I used 700 for starters, 250 for bench players, both of which get reduced to 85% of that total later on, since we don’t project anyone to play 162 games), and then divide by 10.5 to convert from runs to wins. After you’ve done that, you’ve got an offensive win value compared to league average.
That’s step one. From there, it’s easy. You take your offensive wins and adjust for each position using what we know about the defensive spectrum. Catchers get +1.5 wins, shortstops and center fielders get +1 win, second baseman and third baseman get +0.5 wins, left fielders and right fielders get no position adjustment, first baseman get -0.5 wins, and designated hitters get -1.0 win. This positional scale adjusts for the quality of each player’s peers while also ensuring that we don’t make bad assumptions based on the league average line of any one position during a season. We can say with 100% certainty that it’s harder to play shortstop than to play second base, as almost every second baseman is a shortstop who got moved to the easier position at some point in their life, so we don’t ever want to assume that the average second baseman is better than the average shortstop. If we used league average offensive production by position as the comparing baseline, the values wouldn’t be fixed, which is why I prefer the defensive spectrum adjustments.
Okay, so now you have your position player’s offensive performance relative to league average and adjusted for position. Two steps left before we have our final win value. First, we don’t necessarily want to compare all players to league average in valuation methods. What’s a league average player worth? How easy is it to find one? These aren’t intuitive answers, so average doesn’t make for a great baseline. Instead, we want to compare the players to what we’d expect a team to be able to get from a league minimum player that could be acquired with little to no effort. For instance, yesterday the Mariners signed Greg Norton to a minor league contract. He might make the team, he might not, but guys of his quality are always available. He’s the walking definition of replacement level, so we want to compare our first baseman/designated hitter types to what they’d give us over Greg Norton type players. We know these players are worth about $400,000 (league minimum salary, basically), so it gives us a better starting spot for the final valuation.
The freely available talent guys historically perform, as a group, at a level about two wins below average over the course of the full season. Or, said another way, a team full of these league minimum guys would win about 50 games per season. It’s hard to do much worse than 50-110, even if you’re not trying to contend.
So, in addition to the position adjustments, we add a replacement level adjustment of +2 wins for each position. This means that the adjustment is now +3.5 for catchers, +3 for shortstops and center fielders, +2.5 for second baseman and third baseman, +2 for left fielders and right fielders, +1.5 for for first baseman, and +1 for first baseman. So, if you have a catcher who is a league average hitter, you’d say he’s about +3.5 wins offensively, while the exact same hitter would only be worth +1 win if he was a designated hitter. (Note – this is why moving Jeff Clement to DH/1B is not worth it until the Mariners are 100% certain he really can’t catch in the majors).
Okay, so, after all that, you’ve got your offensive win value compared to replacement level and adjusted for position. However, position players don’t just hit – they field, too. So, we have to build in a defensive performance adjustment. While the general range between the best and worst defenders at a position in any given year is about 50 runs (that is, +25 for good and -25 for bad), we want to be a lot more conservative in projecting defensive performance. So, for these purposes, I’ve set the upper and lower bounds at +15/-15, with most players falling in the -5 to +5 range. In other words, besides the exceptionally great or terrible defenders, this adjustment isn’t going to make a massive impact. Personally, since there is no defensive metric that contains all knowledge yet, I looked at UZR, PMR, RZR, Dewan’s +/- (when available), and eyeballed a realistic estimate based on inputs from all four. Then, you simply divide the runs saved/lost estimate by 10.5 to convert to wins, and add the defensive performance to the offensive performance you’ve already ascertained. And that’s your win value.
Let’s walk through it with Ichiro. I’ve got him projected for a .345 wOBA in 2008 (this is an optimistic projection, honestly, and only a slight step back from his 2007 performance), which the math then converts to +3.09 wins for a center fielder. I add in +0.5 wins for his defensive performance, and that gives us Ichiro as a +3.6 win player compared to a freely available center fielder. I’ve also added +.15 wins for his baserunning prowess, which brings him to +3.75 wins. Or, put another way, if Ichiro got hurt in spring training and was replaced by some combination of Willie Bloomquist and Jeremy Reed for 2008, we’d lower our win expectation for the team by about 3.75 wins.
How much is a win worth? Well, MLB as a whole is paying about $4.4 million per win above replacement in the free agent market, and we know a league minimum player makes about $400,000, so (Win Value * 4.4) + .4 will give you the player’s dollar value in terms of wins added for the upcoming season. Keeping with the Ichiro example, we have him as a 3.75 win player, which is worth about $16.9 million in on field performance. Ichiro just got a contract extension for $17 million per season, which included adjustments for factors beyond his baseball skills, including his marketing appeal. So I’d say the model worked pretty well here, eh?
Because Ichiro’s salary is higher than his dollar per win value, he’s listed on the chart as having a negative value of $100,000. That doesn’t mean we think Ichiro is overpaid or less valuable than Jamie Burke – it simply means that he’s a fairly compensated star, and not a major bargain. It’s rare that teams have bargains at the top of their payroll, though, so that’s not really a knock against Ichiro. However, it does mean that, if given the choice between trading Ichiro and trading Yuniesky Betancourt, I would trade Ichiro – it would be easier to replace his performance with the $17 million that became available than it would to replace Betancourt with the $1.25 million that became available if he was traded.
So, in terms of 2008 asset value (not on field value – please note the distinction), I’m comfortable saying that Yuniesky Betancourt is more valuable than Ichiro. That might sound like heresy, but considering there are only a handful of teams that can afford Ichiro’s contract and nearly every team in baseball would love to have Betancourt on their team, it reflects reality.
Okay, enough setup – let’s get to the table. Here are the position players projected wOBA, their associated win values, their dollar per win value, and the value difference between that and their actual salary. All dollar values are in millions.
| Position Player | wOBA | WAR | WAR $ | Salary | Value |
|---|---|---|---|---|---|
| Johjima | 0.320 | 2.29 | $10.48 | $5.20 | $5.28 |
| Sexson | 0.335 | 0.32 | $1.81 | $14.00 | $(12.19) |
| Lopez | 0.305 | 1.25 | $5.90 | $0.50 | $5.40 |
| Betancourt | 0.305 | 1.62 | $7.53 | $1.25 | $6.28 |
| Beltre | 0.335 | 2.67 | $12.15 | $12.00 | $0.15 |
| Ibanez | 0.345 | 0.75 | $3.70 | $5.50 | $(1.80) |
| Ichiro | 0.345 | 3.75 | $16.90 | $17.00 | $(0.10) |
| Wilkerson | 0.325 | 0.76 | $3.74 | $3.00 | $0.74 |
| Vidro | 0.325 | 0.41 | $2.20 | $6.00 | $(3.80) |
| Reed | 0.295 | -0.06 | $0.14 | $0.40 | $(0.26) |
| Morse | 0.315 | 0.05 | $0.62 | $0.40 | $0.22 |
| Bloomquist | 0.290 | 0.00 | $0.40 | $1.00 | $(0.60) |
| Burke | 0.295 | 0.20 | $1.28 | $0.40 | $0.88 |
| Norton | 0.315 | 0.05 | $0.62 | $0.40 | $0.22 |
A quick peak at those numbers before we move on to the pitchers.
Betancourt, Johjima, and Lopez, as a group, project to be just a bit below average. The M’s total cost for those three – $6.95 million. There aren’t too many other teams in baseball getting that kind of quality production for next to no money at those up the middle spots. While they’re all flawed players in their own way, they’re also three of the most valuable assets this organization has.
Hey, look, even projecting an offensive step back for Adrian Beltre, he’s still worth his contract. Hey national media – get a clue; the guy is a good player who is worth every dime he’s being paid.
Richie Sexson, even with a significant rebound projection, is still terrible, and his contract is a boat anchor. A +0.3 win player making $14 million at the easiest position on the diamond to find talent? Ouch.
Total wins above replacement for the position players? +14.1 wins. 14 wins out of 14 players who cost about $66 million in payroll? That’s… not good.
Okay, let’s move on to the pitchers. The process here is easier, so I’ll spend a lot less time explaining it. For starters, I developed a defensive-independent line (because, remember, we’re already counting defense in the position players) adjusted for Safeco, which gave me innings pitched and runs allowed. I then compared this to league average (4.60 ERA, park adjusted) and replacement level (5.52 ERA, park adjusted), divided the difference in projected runs allowed by 10.5 to convert to wins, and wham, you have your win value. For relievers, I built in a leverage factor as well, to account for the fact that every run J.J. Putz saves is more valuable than an average run saved.
Why am I using ERA when I have railed against it for so long? Because it’s easy for everyone to understand, and, because it’s already scaled to runs, we don’t need to show FIP or anything more fancy. The inputs I used to get my defensive independent ERA were more sophisticated than just looking at previous ERA and adjusting, so please don’t assume that I’m bowing to conventional pitcher analysis here. I’m just presenting it in the most palatable form I can. Okay? Good. Here’s the pitcher projections.
| Pitcher | ERA | WAR | WAR $ | Salary | Value |
|---|---|---|---|---|---|
| Bedard | 3.32 | 4.43 | $19.90 | $7.00 | $12.90 |
| Felix | 3.55 | 3.96 | $17.80 | $0.50 | $17.30 |
| Silva | 4.41 | 2.20 | $10.08 | $12.00 | $(1.92) |
| Batista | 4.57 | 1.85 | $8.56 | $9.00 | $(0.44) |
| Washburn | 4.73 | 1.46 | $6.83 | $10.00 | $(3.17) |
| Ramirez | 5.40 | 0.14 | $1.01 | $2.75 | $(1.74) |
| Putz | 2.31 | 2.63 | $11.97 | $3.40 | $8.57 |
| Morrow | 3.45 | 1.03 | $4.91 | $0.40 | $4.51 |
| O’Flaherty | 4.32 | 0.25 | $1.50 | $0.40 | $1.10 |
| Green | 4.05 | 0.53 | $2.71 | $0.40 | $2.31 |
| Rowland-Smith | 4.20 | 0.30 | $1.74 | $0.40 | $1.34 |
| Baek | 4.20 | 0.30 | $1.74 | $0.50 | $1.24 |
| Lowe | 4.80 | -0.04 | $0.23 | $0.40 | $(0.17) |
Pitching staff notes.
Bedard is really good. I’m happy to have him on the roster. Go Erik Go.
Felix is one of the biggest assets in baseball. A +4 win player making, essentially, the league minimum? I’ll take two, please.
Silva’s basically projected right at league average for a starter, with Batista a half win worse and Washburn about a win worse. For the last 60% of a rotation, it’s not bad, but man, did it come at a high price. $31 million for 5 wins? Such is the price of trying to build a rotation through free agency.
Horacio Ramirez is projected to pitch 110 innings, but he basically is a stand in for all starts made by guys not in the current rotation. That includes Baek, Feierabend, Rohrbaugh, whoever. Same thing with Mark Lowe’s 30 innings pitched at the bottom of the bullpen – he’s being used as a proxy for the reliever du jours.
J.J. Putz, still awesome. According to this, he’s the fifth most valuable player on the team and the third biggest value.
Brandon Morrow got a pretty nice projection as a setup man. I made it clear that I didn’t think he was cut out to start in 2008, but I think he’s got a good chance to become a quality 8th inning guy this year. That’s still a monumental waste of a #5 overall pick, but hey, at least he’s contributing something.
The pitching staff as a whole adds up to +19 wins above replacement. Thanks to Erik Bedard and projected improvement from Felix, the pitching staff is now the strength of this club.
Now, let’s take a big picture look at the team as a whole.
The team defensive-independent ERA comes out to 4.12. Over 1430 innings, that’s 654 earned runs allowed. Now, remember, we’re dealing with ERA, not RA, so we have to adjust for unearned runs that bump the total up, and this doesn’t account for defense either. Last year, the team allowed 60 unearned runs, and our projections have the team’s defense being worth about -15 runs, so we need to add about 75 runs to that total. That means this analysis projects the M’s to allow about 725 runs.
Offensively, if I plug my projections into a markov chain, I get about 735 runs scored. A team that scores 735 runs and allows 725 runs will post a .507 win%, or a record of 82-80 in a full season. How does this line-up with my WAR estimates?
+19 for the pitching staff and +14 for the position players = +33 for the roster. Since we’ve got replacement level set at about 50 wins, that gives the M’s something like an 83 win roster.
82 wins if you use projected RS/RA. 83 wins if you use WAR. I’d say win values work pretty well.
Tomorrow, I’ll talk about the potential opportunities for this club to beat these projections, and what we need to be rooting for if we’re going to be better than an 82-83 win club.
Hey, turns out the M’s have a great bench
Remember when I wrote that post about how the M’s might construct their bench to help with the problems with the lineup and people said okay that’s great but none of that will happen because they’re going to take Cairo and holy mackeral is this bench going to be thin and unhelpful? Yeah? Well people were wrong!
The DH position was an offensive bright spot for the Mariners in ’07, with Jose Vidro posting the second-highest batting average (.308) among DHs in the AL. With Vidro returning and the versatile Willie Bloomquist as an option off the bench, Seattle enjoys depth.
Remember when we had Corey Brock writing the M’s content on MLB.com and it was actually pretty good, especially compared to other MLB.com content, before Jim Street came out of retirement to take his job back when Corey moved to cover San Diego?
Yeaahhhh… that was nice.
Pitchers and Catchers! Pitchers and Catchers!
Need I say more? Woooooooo – baseball is back!
And now, for something different
Yea, this post has nothing to do with the Mariners. I think we could all use a break for a day or so.
A lot of people ask us if they can send us money to help support the site. Generally, we tell them to donate it to charity instead. Well, now, I can combine the best of both worlds. My girlfriend (commence joke about bloggers not having social skills… now) is training for a marathon in June with Team In Training, who use marathons as fundraisers for research to find a cure for leukemia and lymphoma. Her mother’s first husband died from leukemia at the age of 19, and she’s dedicating the marathon to him and her brother, who lost his father when he was seven months old. She hopes to raise $5,000 in the next couple of months, and, being the good boyfriend that I am, I offered to put a note on the blog for anyone who wants to donate. Her team in training website can be found here, and you can donate securely online through the site. If you don’t like giving money through the internet, you can drop us an email and I’ll tell you where you can mail a check.
The bonus is that the marathon is in Alaska in June, so we’ll be flying into Seattle on the way up there, and there’s a decent chance we’ll host another USSM event while I’m in town. So, if you give money, you get to support leukemia research, support the site indirectly, and encourage a get together this summer. Everyone wins all around.
Update: $325.00 as of lunch time. You guys rock. $1,000 would be a tremendous starting spot for her, and it looks like it’s within reach.
Update #2: $820.00 $1,950 so far. A huge thank you to all of you who have given so far. She’s overwhelmed by the generosity of others, and had no idea you guys would come through like this. You guys are the best.
What the M’s can still do
To be entirely open, it hasn’t been fun for me here at USSM lately (just deleted-another “you faked results to advance your agenda” comment! Awesome!)(to be clear — that many-seasons thing was not a prediction, it was “hey, I spent a lot of time using DMB, and here’s the interesting stuff that came out of it”)(I suspect that train’s long left the station, though), so it’s time to geek out about one of my favorite topics, roster construction. Benches benches benches!

winter break from paul goyette‘s flickr stream, used under the Creative Commons license
What does the team still need, and how might they still improve, assuming they’re dead-set on making a run for it?
First, the hitters. Let’s assume they’re not going to make any more major moves and dump any of these guys.
DH-B Turbo
C-R Johjima
1B-R Sexson
2B-R Lopez
SS-R Betancourt
3B-R Beltre
LF-L Ibanez
CF-L Ichiro!
RF-L Wilkerson
Nine spots burned.
Burke’s the backup catcher (#10), so that solves that piece. #11 is Bloomquist. Now you have 1-3 spots left, depending on how many pitchers the M’s carry. Let’s figure on 12 pitchers, so you’ve got two bench spots left.
What do you need that you could patch for on the bench? Horrible defense at first and left, and you’re hoping to get average defense in right out of Wilkerson. And you could really use a good pinch runner for those three and Turbo too. And if Bloomquist is your backup infielder, what you really need is two more backup outfielders who can chase flies like nobody’s business. A righty if you can manage it, to sub in for Ibanez or Wilkerson against lefty starters — and they don’t have to be that great to be better than them against lefties. And you could really use another bat off the bench, particularly a decent defensive replacement for Sexson.
If they’re not willing to go shopping, I think you have to go with Reed. His offensive performance was much improved last year in Tacoma, though his projections are not particularly good looking (PECOTA: .265/.321/.385, ZiPS .259/.312/.377) it’s a fine skill set to offer as a 4th outfielder: below-average but not horrible bad, good defense, particularly in the corners, not a base-stealing threat but a decent runner. Especially considering the question of Wilkerson’s durability, it makes even more sense. So I’d take Reed with the #12 spot.
Then what? It’s an interesting question, and I’ve got a couple of possibilities:
– You take Morse as a backup corner infielder/Sexson replacement
– Jimerson as a 5th OFer and pure defensive replacement and runner.
What you really don’t have any need for is a I-can’t-believe-it’s-not-Bloomquist player like Cairo, who also can’t hit, but makes up for it by not being a good runner or fielder.
If you’re willing to spend, you’re not going to a lot better, really. None of Shawn Green/Trot Nixon/Reggie Sanders helps solve a problem you’re carrying. Corey Patterson would be a nice choice — he’s a glove, has some speed, might hit and might not, depending on which season it is. As a 4th OFer in spacious Safeco, he’s a nice choice. And likely comes with a high price tag. Kenny Lofton’s still out there, too, and you could certainly do worse.
There’s Bonds, if you want the ultimate in controversial and risky may-be-in-jail-on-perjury-charges choices. Then you push him into DH/LF as often as circumstances permit… but that’s not going to happen, so forget I mentioned it.
And surveying the field, Patterson’s a great choice if you can get him on the cheap, but beyond that, there’s not a lot to buy for your remaining bench dollar in the lineup.
So flip a coin (which will come up heads 90% of the time) and get yourself a #13 position player, and go on to the pitchers.
SP-L Bedard
SP-R Hernandez
SP-L Washburn
SP-R Silva
SP-R Batista
RP-R: Putz
We’re at 19… and then chaos fills the remaining six spots.
Let’s figure if they’re willing to punt the future, they’re willing to spend another year of Morrow in the pen. Ding! #20. Can I get Aumont, too? I mean why not, right? Then O’Flaherty, sure, that’s your first choice to get a lefty in there. #21.
Looking at that rotation, what do you need? If history’s any guide, some long relief when Silva’s defense fails him and he’s knocked out early, Washburn’s going to need a consistent bridge for the 7th-8th, and you won’t always have Morrow around (or Putz, for that matter). Take Rowland-Smith for long relief (#22), assuming Baek’s your 6th starter in Tacoma, and Sean Green for bridging as RP-R (#23). Now McClaren’ll want another short-use lefty – Rhodes may will break with the team out of spring training if he’s at all effective (#24) though I’d argue you’re better off taking a better righty option if you have one… so you might go with both Huber and Lowe here (I’d love to see Lowe healthy and effective) though they’ll likely only need one (#25 and done).
I don’t see any point on spending more on the bullpen. It’d be costly and probably wouldn’t do much better. And this throws HoRam to the minors/the waiver wire/wherever, which the org is unlikely to do, so you have to drop someone, and that’ll be a substantial downgrade.
Anyway — we know the 2008 starters. The next interesting thing is how they use the resources at hand to try and patch for the squad’s obvious weaknesses.
The 93-win team (more ZiPS fun)
If you’re already annoyed by the sim post, well first I’m not sure what you’re doing hanging around here, but anyway, this is not going to be your post. Come back later or something. I’m serious, this gets into some serious Diamond Mind geekery.
Read more
Running the 2008 season a hundred times
The results of my last couple sim seasons has been bothering me, since it diverged so far general opinion and from what I thought it would be. I decided to look at this in a lot more depth. I used the ZiPS projections for 2008 and SG’s quite useful RunDMB program, cranked up the USSM Labs Comp-u-matik 2000, and went at it.
Then I put together a likely M’s lineup, cheated a little by turning Betancourt’s defensive rating up, and ran a hundred seasons. This took a day.
Your 2008 simulated Mariners:
Average record: 77-85
Average runs scored: 716
Average runs allowed: 759
Number of times they won the division: 6
Number of times they won the wild card: 0
Best season: 93-69
Worst season: 59-103
Best offense: 804 runs
Worst offense: 607 runs
Best run prevention: 674 runs allowed
Worst run prevention: 866 runs allowed
Standard deviation for wins: 71-84
Standard deviation for offense: 674-757
Standard deviation for run prevention: 717-801
The division favorite was not the Angels but the torn-down Athletics, 47% to 42%, and Texas won the division almost as often as the M’s. The A’s-Angels thing is as much a shock as anything. General analyst-on-TV-or-radio seems to be that it’s all about the M’s-Angels, but Oakland fields the best pitching/defense combination in the AL and their offense is decent too.
Added: since this seems to be causing a lot of hostility, I’ll explain part of what’s going on here. The projection set doesn’t include known, current injuries — so when you look at a depth chart and you see that a bunch of their starters are likely to be guys like Saarloos or even Greg Smith because so many will be down for the start of the season, that’s the rub — these weren’t run with them starting off injured for x days and then coming back. You can make your own assessment of how important that is to the outcomes, but they only play two series against the A’s for five games in the first two months of the year. So even if you want to throw out their season finish, the M’s aren’t going to move up substantially in the win column by taking more games from Oakland.
Back to the M’s, though.
Here’s some graphs of the distributions:
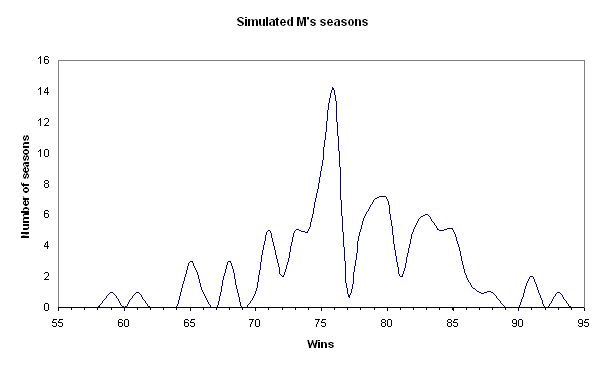
That’s a scatter with smoothed lines.
And for the people who complain about graphs without absolute axis bounds:
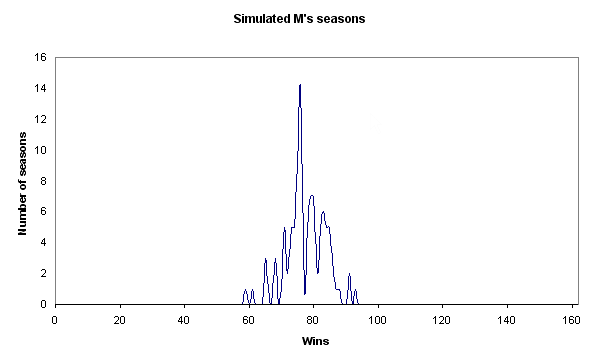
And by request, the bar graph
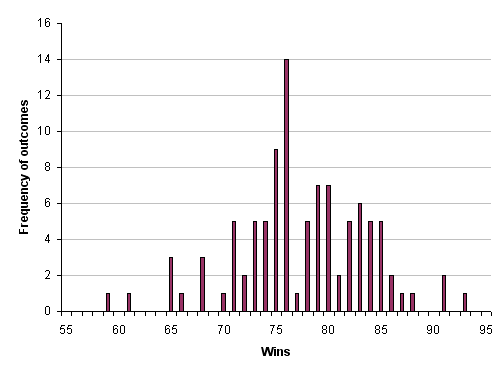
Here’s the cumulative probability:
27% of seasons were 74 wins or under
50% of seasons were 76 wins or under.
77% of the seasons were 82 wins or under
95% of the seasons were 86 wins or under
99% of the seasons were 91 wins or under
I did a projection post back in January. Pre-Bedard-trade, of course, it’s still an interesting contrast. I guessed at ~795 runs scored and ~780 runs allowed. Compared to what I got simulating, that’s too optimistic on the run prevention and way, way optimistic on the runs scored. Clearly, replacing the fifth starter with Bedard and tossing Sherill aside makes a difference in run prevention, but it’s interesting that the overall difference wasn’t all that large — I’d have thought it’d be a lot more than 20 runs. But considering that the trade meant a pretty large defensive downgrade in right plus a whole in the bullpen, it’s reasonable.
The defense is baaaaaaaaaaaaaaaaaaaaaaaad. Even assuming Wilkerson is healthy and passable in right, Ibanez makes that offense bad, and the infield doesn’t make up for it, dragged down by Sexson’s awfulness. And remember, I turned Betancourt’s defense up. The pourous defense particularly hits Washburn and Silva as you’d expect. As Dave told me, they should consider running Reed out in right field when Washburn starts just to keep Washburn’s head from exploding in frustration after giving up the seventh double of a game.
The other interesting thing to note is that DMB, in running through the whole season and simulating every game, does take into account the rotation matchups (which, as I’ve noted, don’t in practice have that much effect). So pushing everyone back a spot doesn’t help.
It’s the runs scored that really hurts. Here’s where the ZiPS differed significantly from the numbers I came up with “random guesses, hunches, wishcasting, and general skullduggery” but which was largely three-year averages:
– Ichiro’s down a little on OBP and off on SLG
– Shaves Beltre by 5 points of OBP and 10 points of SLG
– ZiPS is down on Lopez (.302/.369 versus my .320/.400)
– the Wilkerson ZiPS is lower than my Jones guess
– didn’t give Sexson as much of a bounce (.323/.441 vs my .330/.460)
– down on Johjima (.316/.405 vs my .325/.425)
Please note that when I disagreed with what an excellent projection system came up with, I was high every time, sometimes by a lot. Ponies for everyone!
Since I ran the season, I’ve stared at the results and tried to find a reason to not write this post. Some thing that would invalidate the results, or that would give me an excuse to change something and go back to do it all over with even more pro-Mariner assumptions. But there isn’t. The ZiPS projections have been excellent in the past, and if you use the PECOTA projections the team is just as bad.
If you start from last year’s team and make adjustments, it’s easy to come up with another five, ten, sixteen wins. But starting from scratch, using reasonable assumptions, the picture looks much bleaker.
Go caucus, fellow Washingtonians
It matters, for the first time I can remember in my political life. I promise I’ll put up a gigantic meaty post at two if enough people turn out.
Update: That was really cool. And I’m a delegate!
And now, this pony from our sponsors.

Pony 48 from treehouse1977’s photo stream, used under the Creative Commons license
It’s Done
Press conference at two. Adam Jones, George Sherrill, Chris Tillman, Tony Butler, and Kam Mickolio for Erik Bedard in the most anti-climactic trade in the history of mankind.
So, now that’s official, and practically everything that could be written about this trade has been, I’d like to offer up one last question to those who think the Mariners have done well this off-season in revamping their pitching staff. Assuming that Erik Bedard and Carlos Silva both stay healthy and make their 34 starts, what do you expect the Mariners record to be in those 68 games?
36-32? 38-30? 40-28? I’d imagine that it’s almost certainly going to be somewhere in that range.
The Mariners record in the 68 games in 2008 that were started by Jeff Weaver, Horacio Ramirez, Cha Seung Baek, and Ryan Feierabend? 32-36.
Yep, for all the talk about how terrible the back end of the Mariners rotation was last year (and in terms of individual performance, it was), the Mariners were a .470 club when their #4/#5 starters were on the hill. Even if you believe they’ll be a .560 club with Bedard and Silva on the hill, and if you believe that neither will miss a start all season, then you’re expecting the team to go 38-30 in those 68 games. That’s a 6 win improvement.
(Bedard + Silva) – (Weaver + Ramirez + Feierabend + Baek) = 6 wins, if you assume that no one gets hurt, everyone else on the roster plays at their ’07 level, Wilkerson = Guillen, and losing Sherrill has no impact on the bullpen.
Yep, this trade still sucks.