
Running the 2008 season a hundred times
The results of my last couple sim seasons has been bothering me, since it diverged so far general opinion and from what I thought it would be. I decided to look at this in a lot more depth. I used the ZiPS projections for 2008 and SG’s quite useful RunDMB program, cranked up the USSM Labs Comp-u-matik 2000, and went at it.
Then I put together a likely M’s lineup, cheated a little by turning Betancourt’s defensive rating up, and ran a hundred seasons. This took a day.
Your 2008 simulated Mariners:
Average record: 77-85
Average runs scored: 716
Average runs allowed: 759
Number of times they won the division: 6
Number of times they won the wild card: 0
Best season: 93-69
Worst season: 59-103
Best offense: 804 runs
Worst offense: 607 runs
Best run prevention: 674 runs allowed
Worst run prevention: 866 runs allowed
Standard deviation for wins: 71-84
Standard deviation for offense: 674-757
Standard deviation for run prevention: 717-801
The division favorite was not the Angels but the torn-down Athletics, 47% to 42%, and Texas won the division almost as often as the M’s. The A’s-Angels thing is as much a shock as anything. General analyst-on-TV-or-radio seems to be that it’s all about the M’s-Angels, but Oakland fields the best pitching/defense combination in the AL and their offense is decent too.
Added: since this seems to be causing a lot of hostility, I’ll explain part of what’s going on here. The projection set doesn’t include known, current injuries — so when you look at a depth chart and you see that a bunch of their starters are likely to be guys like Saarloos or even Greg Smith because so many will be down for the start of the season, that’s the rub — these weren’t run with them starting off injured for x days and then coming back. You can make your own assessment of how important that is to the outcomes, but they only play two series against the A’s for five games in the first two months of the year. So even if you want to throw out their season finish, the M’s aren’t going to move up substantially in the win column by taking more games from Oakland.
Back to the M’s, though.
Here’s some graphs of the distributions:
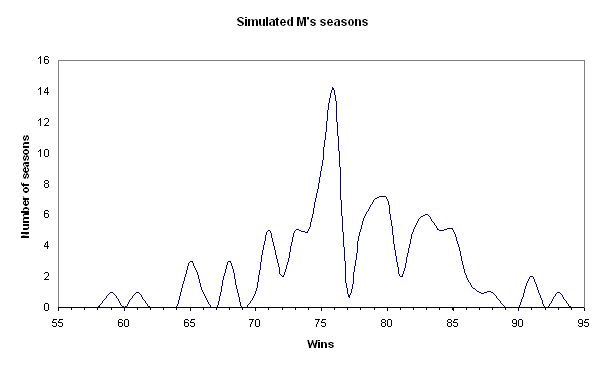
That’s a scatter with smoothed lines.
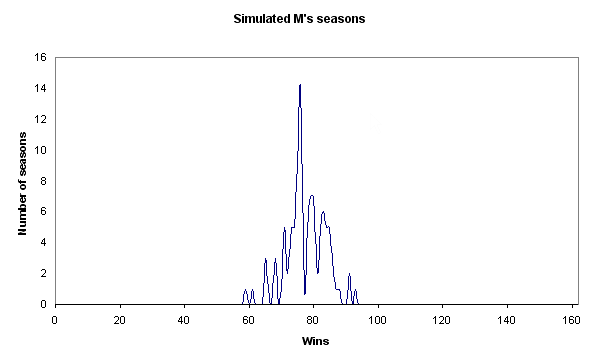
And for the people who complain about graphs without absolute axis bounds:
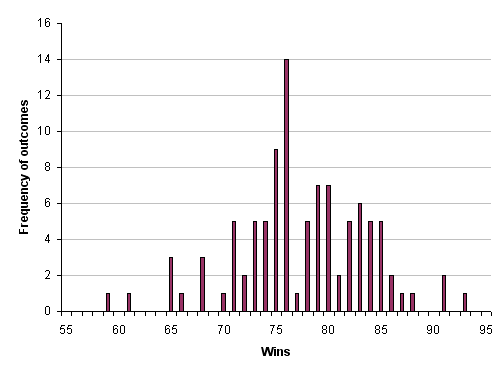
And by request, the bar graph
Here’s the cumulative probability:
27% of seasons were 74 wins or under
50% of seasons were 76 wins or under.
77% of the seasons were 82 wins or under
95% of the seasons were 86 wins or under
99% of the seasons were 91 wins or under
I did a projection post back in January. Pre-Bedard-trade, of course, it’s still an interesting contrast. I guessed at ~795 runs scored and ~780 runs allowed. Compared to what I got simulating, that’s too optimistic on the run prevention and way, way optimistic on the runs scored. Clearly, replacing the fifth starter with Bedard and tossing Sherill aside makes a difference in run prevention, but it’s interesting that the overall difference wasn’t all that large — I’d have thought it’d be a lot more than 20 runs. But considering that the trade meant a pretty large defensive downgrade in right plus a whole in the bullpen, it’s reasonable.
The defense is baaaaaaaaaaaaaaaaaaaaaaaad. Even assuming Wilkerson is healthy and passable in right, Ibanez makes that offense bad, and the infield doesn’t make up for it, dragged down by Sexson’s awfulness. And remember, I turned Betancourt’s defense up. The pourous defense particularly hits Washburn and Silva as you’d expect. As Dave told me, they should consider running Reed out in right field when Washburn starts just to keep Washburn’s head from exploding in frustration after giving up the seventh double of a game.
The other interesting thing to note is that DMB, in running through the whole season and simulating every game, does take into account the rotation matchups (which, as I’ve noted, don’t in practice have that much effect). So pushing everyone back a spot doesn’t help.
It’s the runs scored that really hurts. Here’s where the ZiPS differed significantly from the numbers I came up with “random guesses, hunches, wishcasting, and general skullduggery” but which was largely three-year averages:
– Ichiro’s down a little on OBP and off on SLG
– Shaves Beltre by 5 points of OBP and 10 points of SLG
– ZiPS is down on Lopez (.302/.369 versus my .320/.400)
– the Wilkerson ZiPS is lower than my Jones guess
– didn’t give Sexson as much of a bounce (.323/.441 vs my .330/.460)
– down on Johjima (.316/.405 vs my .325/.425)
Please note that when I disagreed with what an excellent projection system came up with, I was high every time, sometimes by a lot. Ponies for everyone!
Since I ran the season, I’ve stared at the results and tried to find a reason to not write this post. Some thing that would invalidate the results, or that would give me an excuse to change something and go back to do it all over with even more pro-Mariner assumptions. But there isn’t. The ZiPS projections have been excellent in the past, and if you use the PECOTA projections the team is just as bad.
If you start from last year’s team and make adjustments, it’s easy to come up with another five, ten, sixteen wins. But starting from scratch, using reasonable assumptions, the picture looks much bleaker.