
Throwing the Book at the M’s Lineup
The M’s 2010 offense was a spectacle none of us will forget, however hard we might want to. If you’ve been reading for any length of time, you know that scoring runs is just one part of the WAR equation, and that run suppression is just as important. But clearly, the M’s gave their pitchers/defenders a hopeless job last year, and while regression to the mean will help the M’s score more runs, the gap between where they were and plain old ‘bad’ is still huge. This team’s upgraded the offense, particularly at DH, but while regression and luck may giveth, aging taketh away (Jack Wilson, Milton Bradley, Chone Figgins and Jack Cust are all 30+, and while Ichiro doesn’t fit traditional aging curves, the man IS 37). The M’s offense has a lot riding on a good year from its prospects, the health/improvement of Jack Wilson and a bounce-back year from Figgins or Bradley. All of this means deploying these meager resources wisely is more important to the M’s this year than it is for other teams.
Using a neutral projection system (I’ve chosen CAIRO, as it breaks down projections by batter handedness), I’ve taken a stab at an optimal line-up for this decidedly sub-optimal collection of hitters. Steel yourself, then take a look.
Read more
Running the 2008 season a hundred times
The results of my last couple sim seasons has been bothering me, since it diverged so far general opinion and from what I thought it would be. I decided to look at this in a lot more depth. I used the ZiPS projections for 2008 and SG’s quite useful RunDMB program, cranked up the USSM Labs Comp-u-matik 2000, and went at it.
Then I put together a likely M’s lineup, cheated a little by turning Betancourt’s defensive rating up, and ran a hundred seasons. This took a day.
Your 2008 simulated Mariners:
Average record: 77-85
Average runs scored: 716
Average runs allowed: 759
Number of times they won the division: 6
Number of times they won the wild card: 0
Best season: 93-69
Worst season: 59-103
Best offense: 804 runs
Worst offense: 607 runs
Best run prevention: 674 runs allowed
Worst run prevention: 866 runs allowed
Standard deviation for wins: 71-84
Standard deviation for offense: 674-757
Standard deviation for run prevention: 717-801
The division favorite was not the Angels but the torn-down Athletics, 47% to 42%, and Texas won the division almost as often as the M’s. The A’s-Angels thing is as much a shock as anything. General analyst-on-TV-or-radio seems to be that it’s all about the M’s-Angels, but Oakland fields the best pitching/defense combination in the AL and their offense is decent too.
Added: since this seems to be causing a lot of hostility, I’ll explain part of what’s going on here. The projection set doesn’t include known, current injuries — so when you look at a depth chart and you see that a bunch of their starters are likely to be guys like Saarloos or even Greg Smith because so many will be down for the start of the season, that’s the rub — these weren’t run with them starting off injured for x days and then coming back. You can make your own assessment of how important that is to the outcomes, but they only play two series against the A’s for five games in the first two months of the year. So even if you want to throw out their season finish, the M’s aren’t going to move up substantially in the win column by taking more games from Oakland.
Back to the M’s, though.
Here’s some graphs of the distributions:
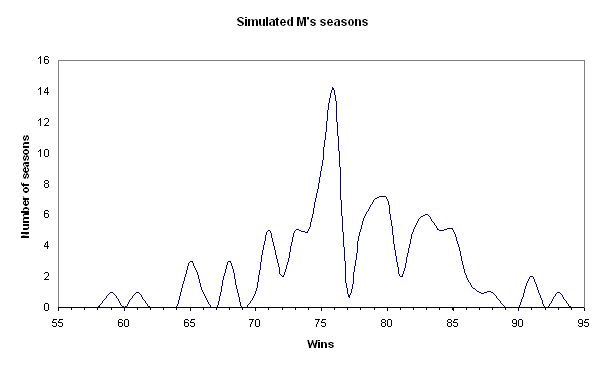
That’s a scatter with smoothed lines.
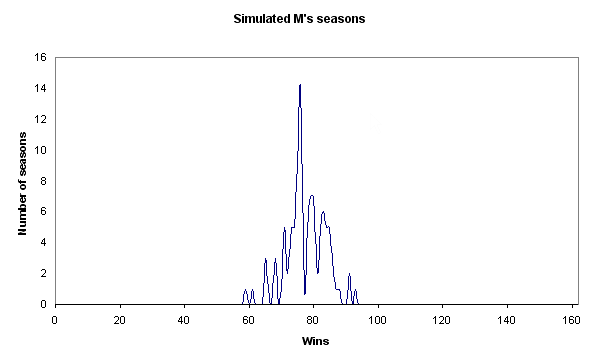
And for the people who complain about graphs without absolute axis bounds:
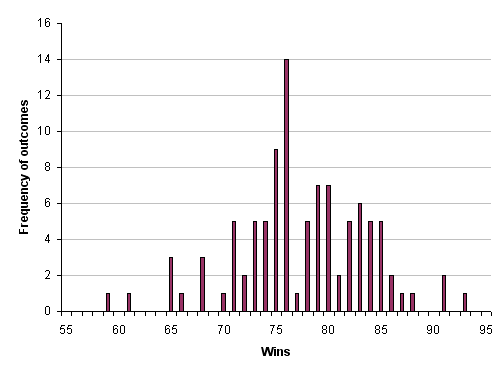
And by request, the bar graph
Here’s the cumulative probability:
27% of seasons were 74 wins or under
50% of seasons were 76 wins or under.
77% of the seasons were 82 wins or under
95% of the seasons were 86 wins or under
99% of the seasons were 91 wins or under
I did a projection post back in January. Pre-Bedard-trade, of course, it’s still an interesting contrast. I guessed at ~795 runs scored and ~780 runs allowed. Compared to what I got simulating, that’s too optimistic on the run prevention and way, way optimistic on the runs scored. Clearly, replacing the fifth starter with Bedard and tossing Sherill aside makes a difference in run prevention, but it’s interesting that the overall difference wasn’t all that large — I’d have thought it’d be a lot more than 20 runs. But considering that the trade meant a pretty large defensive downgrade in right plus a whole in the bullpen, it’s reasonable.
The defense is baaaaaaaaaaaaaaaaaaaaaaaad. Even assuming Wilkerson is healthy and passable in right, Ibanez makes that offense bad, and the infield doesn’t make up for it, dragged down by Sexson’s awfulness. And remember, I turned Betancourt’s defense up. The pourous defense particularly hits Washburn and Silva as you’d expect. As Dave told me, they should consider running Reed out in right field when Washburn starts just to keep Washburn’s head from exploding in frustration after giving up the seventh double of a game.
The other interesting thing to note is that DMB, in running through the whole season and simulating every game, does take into account the rotation matchups (which, as I’ve noted, don’t in practice have that much effect). So pushing everyone back a spot doesn’t help.
It’s the runs scored that really hurts. Here’s where the ZiPS differed significantly from the numbers I came up with “random guesses, hunches, wishcasting, and general skullduggery” but which was largely three-year averages:
– Ichiro’s down a little on OBP and off on SLG
– Shaves Beltre by 5 points of OBP and 10 points of SLG
– ZiPS is down on Lopez (.302/.369 versus my .320/.400)
– the Wilkerson ZiPS is lower than my Jones guess
– didn’t give Sexson as much of a bounce (.323/.441 vs my .330/.460)
– down on Johjima (.316/.405 vs my .325/.425)
Please note that when I disagreed with what an excellent projection system came up with, I was high every time, sometimes by a lot. Ponies for everyone!
Since I ran the season, I’ve stared at the results and tried to find a reason to not write this post. Some thing that would invalidate the results, or that would give me an excuse to change something and go back to do it all over with even more pro-Mariner assumptions. But there isn’t. The ZiPS projections have been excellent in the past, and if you use the PECOTA projections the team is just as bad.
If you start from last year’s team and make adjustments, it’s easy to come up with another five, ten, sixteen wins. But starting from scratch, using reasonable assumptions, the picture looks much bleaker.
PECOTAs are out! Wooooooooo!
I know this shows what a dork I am, but the PECOTA forecasts are out! Even if you’re not a fan of Steve Goldman and Dan Fox, subscribing to BP is worth it just for PECOTA season.
Fun stuff. Random notes:
* Bedard’s 2008 puts him at about +4 wins over a replacement pitcher, making him the 10th-most-valuable pitcher in baseball.
* Jones’s 2008 puts him at about +2 wins over a replacement player, and his comps are not qhat I’d expected: Steve Hosey, Chet Lemon, Larry Hisle, and Jack Clark
* Jones’ upside, which is a measure of his potential over the next five years, is 198. That’s the 19th-highest for hitters in all of baseball
* All of baseball
* It’s just behind BJ Upton and ahead of Curtis Granderson
* Bedard’s is 232, the 7th-highest pitcher number, and just ahead of Felix.
* Jones’ total contribution in 2008 is the highest of any Mariner hitter
Okay, I’ll stop with the Jones stuff. What else…hitters:
* PECOTA still hates Ichiro. I look forward to the annual “you know, I think this year it might be right” post.
* Clement comes off better than I thought he might
* Sexson bounces, but not too high
* Lopez’s line is ugly
* Wilkerson’s at .232/.326/.420, a big step back from Guillen’s 2007
* Vidro hits .282/.346/.373 which is even lower than I guessed at in the “Projecting the 2008 Mariners” post a week ago
* Balentien’s line as a major leaguer is bad
* Small steps back for Beltre, Johjima, Betancourt, Ibanez
* Bloomquist is mercifully left off
As a team, the current lineup looks like it drops 10 points of OBP and 20 points of SLG. Dropping the Ichiro forecast, it’s maybe 5 points of OBP and 10 points of slugging — so offensively, they drop a game in the standings.
Pitchers:
* Progress for Felix
* Little bit of regression for Putz
* HoRam is listed as “swing” and is bad
* Washburn and Batista both go badly (150 IP of worse than 2007)
* Silva’s line is uuuuuuuuugly. Really ugly. How bad? It’s about where Jeff Weaver’s 2008 projection is.
* Sherrill’s the third-best pitcher on the team at +13 runs over replacement (making him+Jones just shy of Bedard’s contribution)
Overall, with Bedard, it’s a low-walk, low-K staff with about a 4.50 ERA, and only one serious groundball pitcher in Felix (only one seems like an odd projection, I’ll have to think about that more). The pitching side improves, but on the whole it doesn’t improve much at all. 30 runs, maybe? I’d have to go crunch that one out — I can’t eyeball pitching stats the same way I can the offensive numbers. It might be less of an improvement, if you threw the defense in there to get to a runs-per-game number.
Anyway — yeah, check it out. I love PECOTA forecasts, and totally recommend them for your forecast needs. Nate does a great job, and I look forward to the more formal player cards. If nothing else, they’ve always served me well in thinking about comparable players, development paths, and giving me a point to challenge my own conception of a player. When the cards come out, even if you don’t normally read BP, it’d be worth a month’s subscription just to be able to browse those things.