
Running the 2008 season a hundred times
The results of my last couple sim seasons has been bothering me, since it diverged so far general opinion and from what I thought it would be. I decided to look at this in a lot more depth. I used the ZiPS projections for 2008 and SG’s quite useful RunDMB program, cranked up the USSM Labs Comp-u-matik 2000, and went at it.
Then I put together a likely M’s lineup, cheated a little by turning Betancourt’s defensive rating up, and ran a hundred seasons. This took a day.
Your 2008 simulated Mariners:
Average record: 77-85
Average runs scored: 716
Average runs allowed: 759
Number of times they won the division: 6
Number of times they won the wild card: 0
Best season: 93-69
Worst season: 59-103
Best offense: 804 runs
Worst offense: 607 runs
Best run prevention: 674 runs allowed
Worst run prevention: 866 runs allowed
Standard deviation for wins: 71-84
Standard deviation for offense: 674-757
Standard deviation for run prevention: 717-801
The division favorite was not the Angels but the torn-down Athletics, 47% to 42%, and Texas won the division almost as often as the M’s. The A’s-Angels thing is as much a shock as anything. General analyst-on-TV-or-radio seems to be that it’s all about the M’s-Angels, but Oakland fields the best pitching/defense combination in the AL and their offense is decent too.
Added: since this seems to be causing a lot of hostility, I’ll explain part of what’s going on here. The projection set doesn’t include known, current injuries — so when you look at a depth chart and you see that a bunch of their starters are likely to be guys like Saarloos or even Greg Smith because so many will be down for the start of the season, that’s the rub — these weren’t run with them starting off injured for x days and then coming back. You can make your own assessment of how important that is to the outcomes, but they only play two series against the A’s for five games in the first two months of the year. So even if you want to throw out their season finish, the M’s aren’t going to move up substantially in the win column by taking more games from Oakland.
Back to the M’s, though.
Here’s some graphs of the distributions:
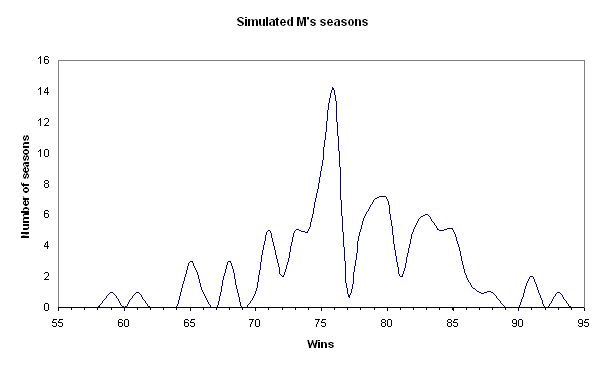
That’s a scatter with smoothed lines.
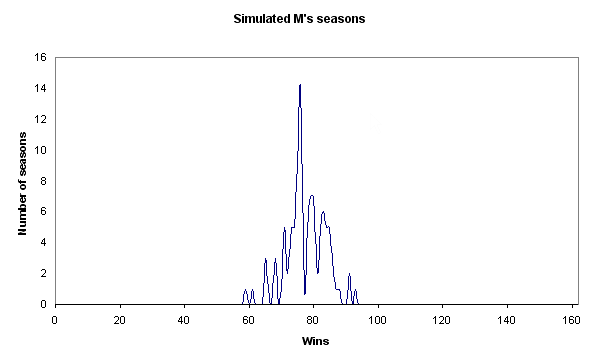
And for the people who complain about graphs without absolute axis bounds:
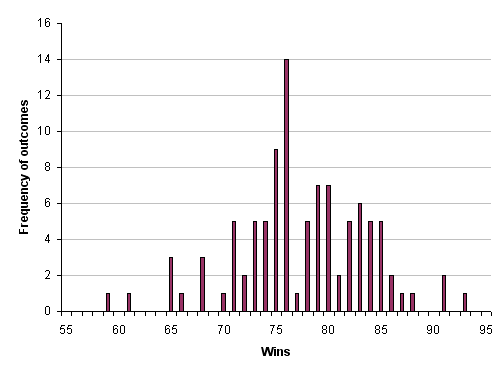
And by request, the bar graph
Here’s the cumulative probability:
27% of seasons were 74 wins or under
50% of seasons were 76 wins or under.
77% of the seasons were 82 wins or under
95% of the seasons were 86 wins or under
99% of the seasons were 91 wins or under
I did a projection post back in January. Pre-Bedard-trade, of course, it’s still an interesting contrast. I guessed at ~795 runs scored and ~780 runs allowed. Compared to what I got simulating, that’s too optimistic on the run prevention and way, way optimistic on the runs scored. Clearly, replacing the fifth starter with Bedard and tossing Sherill aside makes a difference in run prevention, but it’s interesting that the overall difference wasn’t all that large — I’d have thought it’d be a lot more than 20 runs. But considering that the trade meant a pretty large defensive downgrade in right plus a whole in the bullpen, it’s reasonable.
The defense is baaaaaaaaaaaaaaaaaaaaaaaad. Even assuming Wilkerson is healthy and passable in right, Ibanez makes that offense bad, and the infield doesn’t make up for it, dragged down by Sexson’s awfulness. And remember, I turned Betancourt’s defense up. The pourous defense particularly hits Washburn and Silva as you’d expect. As Dave told me, they should consider running Reed out in right field when Washburn starts just to keep Washburn’s head from exploding in frustration after giving up the seventh double of a game.
The other interesting thing to note is that DMB, in running through the whole season and simulating every game, does take into account the rotation matchups (which, as I’ve noted, don’t in practice have that much effect). So pushing everyone back a spot doesn’t help.
It’s the runs scored that really hurts. Here’s where the ZiPS differed significantly from the numbers I came up with “random guesses, hunches, wishcasting, and general skullduggery” but which was largely three-year averages:
– Ichiro’s down a little on OBP and off on SLG
– Shaves Beltre by 5 points of OBP and 10 points of SLG
– ZiPS is down on Lopez (.302/.369 versus my .320/.400)
– the Wilkerson ZiPS is lower than my Jones guess
– didn’t give Sexson as much of a bounce (.323/.441 vs my .330/.460)
– down on Johjima (.316/.405 vs my .325/.425)
Please note that when I disagreed with what an excellent projection system came up with, I was high every time, sometimes by a lot. Ponies for everyone!
Since I ran the season, I’ve stared at the results and tried to find a reason to not write this post. Some thing that would invalidate the results, or that would give me an excuse to change something and go back to do it all over with even more pro-Mariner assumptions. But there isn’t. The ZiPS projections have been excellent in the past, and if you use the PECOTA projections the team is just as bad.
If you start from last year’s team and make adjustments, it’s easy to come up with another five, ten, sixteen wins. But starting from scratch, using reasonable assumptions, the picture looks much bleaker.
Go caucus, fellow Washingtonians
It matters, for the first time I can remember in my political life. I promise I’ll put up a gigantic meaty post at two if enough people turn out.
Update: That was really cool. And I’m a delegate!
And now, this pony from our sponsors.

Pony 48 from treehouse1977’s photo stream, used under the Creative Commons license
It’s Done
Press conference at two. Adam Jones, George Sherrill, Chris Tillman, Tony Butler, and Kam Mickolio for Erik Bedard in the most anti-climactic trade in the history of mankind.
So, now that’s official, and practically everything that could be written about this trade has been, I’d like to offer up one last question to those who think the Mariners have done well this off-season in revamping their pitching staff. Assuming that Erik Bedard and Carlos Silva both stay healthy and make their 34 starts, what do you expect the Mariners record to be in those 68 games?
36-32? 38-30? 40-28? I’d imagine that it’s almost certainly going to be somewhere in that range.
The Mariners record in the 68 games in 2008 that were started by Jeff Weaver, Horacio Ramirez, Cha Seung Baek, and Ryan Feierabend? 32-36.
Yep, for all the talk about how terrible the back end of the Mariners rotation was last year (and in terms of individual performance, it was), the Mariners were a .470 club when their #4/#5 starters were on the hill. Even if you believe they’ll be a .560 club with Bedard and Silva on the hill, and if you believe that neither will miss a start all season, then you’re expecting the team to go 38-30 in those 68 games. That’s a 6 win improvement.
(Bedard + Silva) – (Weaver + Ramirez + Feierabend + Baek) = 6 wins, if you assume that no one gets hurt, everyone else on the roster plays at their ’07 level, Wilkerson = Guillen, and losing Sherrill has no impact on the bullpen.
Yep, this trade still sucks.
Times: it’s done
…
Press conference soon.
Predicting the 2008 M’s fortunes
As we wait and wait for the axe to fall on the trade…

I’ve run some guesstimates, some numbers, and some simulations using projection data to see where the Mariners might turn out. Normally, those kind of exercises are interesting but kind of pointless: it’s why you play the games, right? And if I’m guessing at one thing and the sims come out a lot lower, so what — it’s not as if any of these things affects the team’s fortunes. I could tinker with the team’s lineup in DMB and run a million simulated seasons and it wouldn’t help or hurt their actual performance.
“My Little Pony” photo by Katie@! and used under the Creative Commons license.
It’s more important this season, though. The M’s have decided they’re going to take a shot at the division title and are making a potentially huge long-term sacrifice for a short-term gain. It’s the result of their assessment of the team’s potential this season. If they’re wrong, they’ve done themselves wrong. If they’re right, the rewards for getting the team to the playoffs are huge.
That’s why I look at the sims, for instance, and frown. If the trade off was Jones for a World Series, I would take it — I think any of us would. It’s not that certain, of course. But if the team’s really only going to win 88 games with Bedard and miss the playoffs, or if they’re going to finish much worse than that, the long-term tradeoff isn’t worth it.
To return to the sims, for a second — I’m as inclined as anyone to look at results like that and dismiss them, but I want to be able to have a good reason to. I don’t. ZiPS projections are pretty good — last year they ran alongside PECOTA. I can argue why I think some of them are off, but as a system, it’s tough to argue with the results.
And when I took a swing at coming up with runs scored/allowed numbers for the team and putting that into wins, there are points where I could say “there’s a pretty large margin for variation here” but it was for both good and bad, and taking only the good isn’t reasonable. Lopez might resume his growth as a hitter, but maybe Sexson doesn’t bounce back at all. Ibanez might be healthy, able to run better and hit well, and Washburn could be bothered by his elbow and have a bad year. I don’t see the team is all potential for improvement, or all candidates for collapse.
The M’s almost certainly understand that given their runs allowed and runs scored numbers last year, their W-L record should have been worse than it was. But I’d bet, as some of our commenters have pointed out, that they’ve got a whole set of reasons why the win total is for real: the disaster starts, injuries, Rick White, veteran grit and clubhouse leadership. There’s a natural tendency to justify favorable luck as the product of things they did, while dismissing bad results as circumstance.
I don’t know what they think supports their belief that they can run with the Angels this year. I would bet they’re not running Diamond Mind sims with projection data, but they’ve certainly had organizational meetings over the winter where they came to agreement about all of this. And we know that they value players much differently than I do, and measure them on different criteria.
But knowing where a team is, and how it’s likely to do, is one of the most important things they can do well. A team that knows when to try to go all out to build a championship team that year or when to look to youth and a longer timeframe will do far better than one that does those things at the wrong times (and the last few years are filled with examples of the former).
I hope, for the M’s sake and my own as a fan, that whatever they’re thinking turns out to be correct this season, because they’re betting a huge chunk of the team’s future on their belief that the short-term improvement of Bedard is worth the long-term sacrifice. That I don’t see that that’s likely doesn’t mean it won’t happen, or that I’m not hoping they’re right.
Calculating Wins Above Replacement
If you’ve read the blog for a while, you’ve seen us refer to players as +/- so many wins. For instance, I’ll often call Adam Jones a “two win player” and Erik Bedard a “five win player” when talking about their 2008 value.
If you’ve ever wondered where those numbers come from, Tango has the post for you. In it, he breaks down the basics for calculating a player’s win values yourself. It’s actually easier than you might think, assuming math doesn’t make your head explode.
On a job application for running a major league franchise, this should be question #1. If you can’t grasp this concept, you don’t get to make decisions.
Open call for sim help
Hey, if anyone knows how to fairly easily automate the running of a ton of seasons in DMB for Mariner-related analysis, can you drop us a line? I’m interested in doing some more work on the team, lineups, and related good stuff, but it’s such a pain to run seasons manually that I’m unlikely to do it unless it can be automated or someone wants to pay me a ton of money for the time and effort.
Jose Vidro signs with Red Sox
Today, the Boston Red Sox announced the signing of Sean Casey to a 1 year, $750,000 deal to fill a spot on their bench. He’s slotted in to be their backup first baseman and occassional pinch hitter. Barring an unforseen injury, he’ll probably get 150-200 at-bats this year.
In case you hadn’t noticed, Sean Casey and Jose Vidro are the exact same hitter. Here are their 2007 performances:
BA: Vidro, .314; Casey, .297
OBP: Vidro, .378; Casey, .354
SLG: Vidro, .394; Casey, .395
BB%: Vidro, 10.8%; Casey, 9.9%
K%: Vidro, 9.1%; Casey, 8.3%
GB%: Vidro, 51%; Casey, 49%
LD%: Vidro, 19%; Casey, 20%
The entire difference between Jose Vidro and Sean Casey’s 2007 performance could be chalked up to infield singles; Sean Casey got 6, while Jose Vidro got 15. There’s just no reason to believe that Vidro’s ridiculously high number of infield hits had anything to do with his skills. If you convert nine of Sean Casey’s outs into infield singles, he’d have hit .315/.371/.413. Eliminating infield singles from the big picture, Casey and Vidro had the exact same batting average last year. Vidro has the tiniest edge in walk rate, but Casey has an equally small edge in power.
You can’t find two more similar hitters alive right now. They were born a month apart in 1974. They both used to be very good players. They’ve both battled injury problems and now live off their ability to make contact and hit singles. The projections for 2008 are basically identical across the board, no matter what projection system you want to use. These guys are offensive twins.
There are, however, two differences. Sean Casey can still play defense (he’d be a significant upgrade with the glove over Richie Sexson) and everyone else in baseball realizes that this skillset isn’t good enough to lay claim to a starting job.
Every other team in baseball looked at this skillset and said “not interested”. The Red Sox looked at this skillset and said “useful bench player if he’ll play for nothing”. The Mariners looked at this skillset and said “Starting DH, $6 million salary, #2 hitter”.
Useful players that signed this winter for less than the $5 million difference in salary between Vidro and Casey: Milton Bradley, Adam Everett, Cliff Floyd, Jason Jennings, Jon Lieber, Jeremy Affeldt, Randy Wolf, Kerry Wood, LaTroy Hawkins, and Mark Hendrickson.
The lesson, as always – the Mariners continue to get destroyed by every other organization in baseball when it comes to building their roster.
M’s to win 105 games
They won 88 games, right? And they exceeded what you’d expect for the runs they scored and gave up, but that’s a product of having Weaver and HoRam getting blown out all the time and the bullpen. So replacing Weaver and HoRam, with Silva/Bedard, that’s ten wins, Sexson has to rebound so you get another four wins there, Lopez is a good young player and he should improve so that’s another two wins from last year. Then you take the ace pressure off Felix, that’s another win as he’s more comfortable.
105. No problem.